
Turn on suggestions
Auto-suggest helps you quickly narrow down your search results by suggesting possible matches as you type.
Showing results for
Please log in to access translation
Turn on suggestions
Auto-suggest helps you quickly narrow down your search results by suggesting possible matches as you type.
Showing results for
Community Tip - You can subscribe to a forum, label or individual post and receive email notifications when someone posts a new topic or reply. Learn more! X
Translate the entire conversation x
Please log in to access translation
Options
- Subscribe to RSS Feed
- Mark Topic as New
- Mark Topic as Read
- Float this Topic for Current User
- Bookmark
- Subscribe
- Mute
- Printer Friendly Page
3D plot, call data from a table
Jun 14, 2014
10:46 AM
- Mark as New
- Bookmark
- Subscribe
- Mute
- Subscribe to RSS Feed
- Permalink
- Notify Moderator
Please log in to access translation
Jun 14, 2014
10:46 AM
3D plot, call data from a table
Hello All,
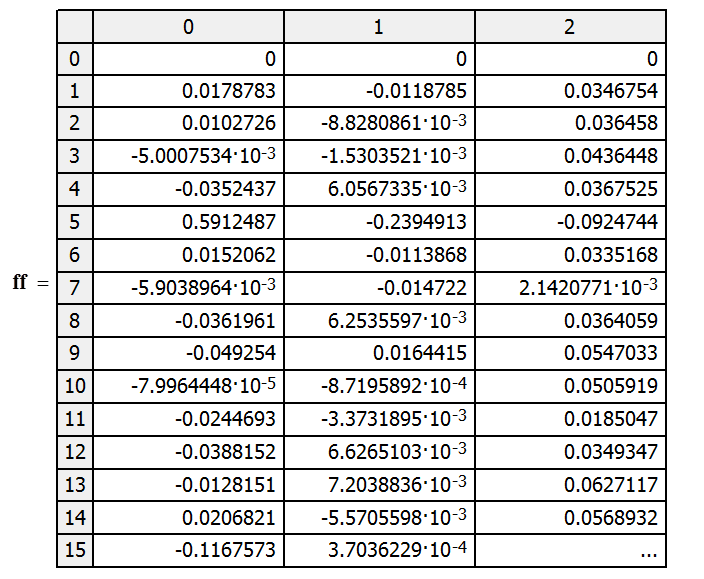
My program returns calculated parameters in a table like the attached picture. How can I address Mathcad to 3D-plot the the first column vs the other columns. How can I recall the data from the dolumns to use them for the next programing stage?
Thank you.
Payman
Solved! Go to Solution.
ACCEPTED SOLUTION
Accepted Solutions
Jun 14, 2014
01:36 PM
- Mark as New
- Bookmark
- Subscribe
- Mute
- Subscribe to RSS Feed
- Permalink
- Notify Moderator
Please log in to access translation
Jun 14, 2014
01:36 PM
- You have created 3 plots instead of 1. You have to put the three vectors in parentheses - use ' for this
- You have to chose plottype "scatter plot". You have not enough information for a surface plot.
4 REPLIES 4
Jun 14, 2014
11:02 AM
- Mark as New
- Bookmark
- Subscribe
- Mute
- Subscribe to RSS Feed
- Permalink
- Notify Moderator
Please log in to access translation
Jun 14, 2014
11:02 AM
Please post your worksheet, not just a pic.
How can I address Mathcad to 3D-plot the the first column vs the other columns. How can I recall the data from the dolumns to use them for the next programing stage?
The answer for both questions is about the same: Use the matrix column selector (Ctrl-6).
Jun 14, 2014
12:56 PM
- Mark as New
- Bookmark
- Subscribe
- Mute
- Subscribe to RSS Feed
- Permalink
- Notify Moderator
Please log in to access translation
Jun 14, 2014
12:56 PM
thank you. The program is attached. I want to plot the first column on z-axis and the other columns as x-y.
Your comment was helpful. But the plot is not stable. How can I make it to appear constantly? or make a copy of the plot ?
Thank you again
Jun 14, 2014
01:36 PM
- Mark as New
- Bookmark
- Subscribe
- Mute
- Subscribe to RSS Feed
- Permalink
- Notify Moderator
Please log in to access translation
Jun 14, 2014
01:36 PM
- You have created 3 plots instead of 1. You have to put the three vectors in parentheses - use ' for this
- You have to chose plottype "scatter plot". You have not enough information for a surface plot.
Jun 14, 2014
01:45 PM
- Mark as New
- Bookmark
- Subscribe
- Mute
- Subscribe to RSS Feed
- Permalink
- Notify Moderator
Please log in to access translation
Jun 14, 2014
01:45 PM
Thank you.


