
Turn on suggestions
Auto-suggest helps you quickly narrow down your search results by suggesting possible matches as you type.
Showing results for
Please log in to access translation
Turn on suggestions
Auto-suggest helps you quickly narrow down your search results by suggesting possible matches as you type.
Showing results for
Community Tip - Learn all about PTC Community Badges. Engage with PTC and see how many you can earn! X
Translate the entire conversation x
Please log in to access translation
Options
- Subscribe to RSS Feed
- Mark Topic as New
- Mark Topic as Read
- Float this Topic for Current User
- Bookmark
- Subscribe
- Mute
- Printer Friendly Page
Animate a set of data(x and y values only)
Apr 07, 2015
03:33 PM
- Mark as New
- Bookmark
- Subscribe
- Mute
- Subscribe to RSS Feed
- Permalink
- Notify Moderator
Please log in to access translation
Apr 07, 2015
03:33 PM
Animate a set of data(x and y values only)
I have a set of data that has appx 27,000 lines. The data is in excel. I can plot the data from tables but is it possible to animate the data starting from the beginning of the data? The data mimics a hysteresis graph and plots nicely. I would like to animate the data.
Solved! Go to Solution.
Labels:
- Labels:
-
Statistics_Analysis
- Tags:
- animate data
ACCEPTED SOLUTION
Accepted Solutions
Apr 07, 2015
06:17 PM
- Mark as New
- Bookmark
- Subscribe
- Mute
- Subscribe to RSS Feed
- Permalink
- Notify Moderator
Please log in to access translation
9 REPLIES 9
Apr 07, 2015
04:37 PM
- Mark as New
- Bookmark
- Subscribe
- Mute
- Subscribe to RSS Feed
- Permalink
- Notify Moderator
Please log in to access translation
Apr 07, 2015
04:37 PM
You can animate a graph in Mathcad 15, but not in Mathcad Prime.
Apr 07, 2015
05:33 PM
- Mark as New
- Bookmark
- Subscribe
- Mute
- Subscribe to RSS Feed
- Permalink
- Notify Moderator
Please log in to access translation
Apr 07, 2015
05:33 PM
Richard,
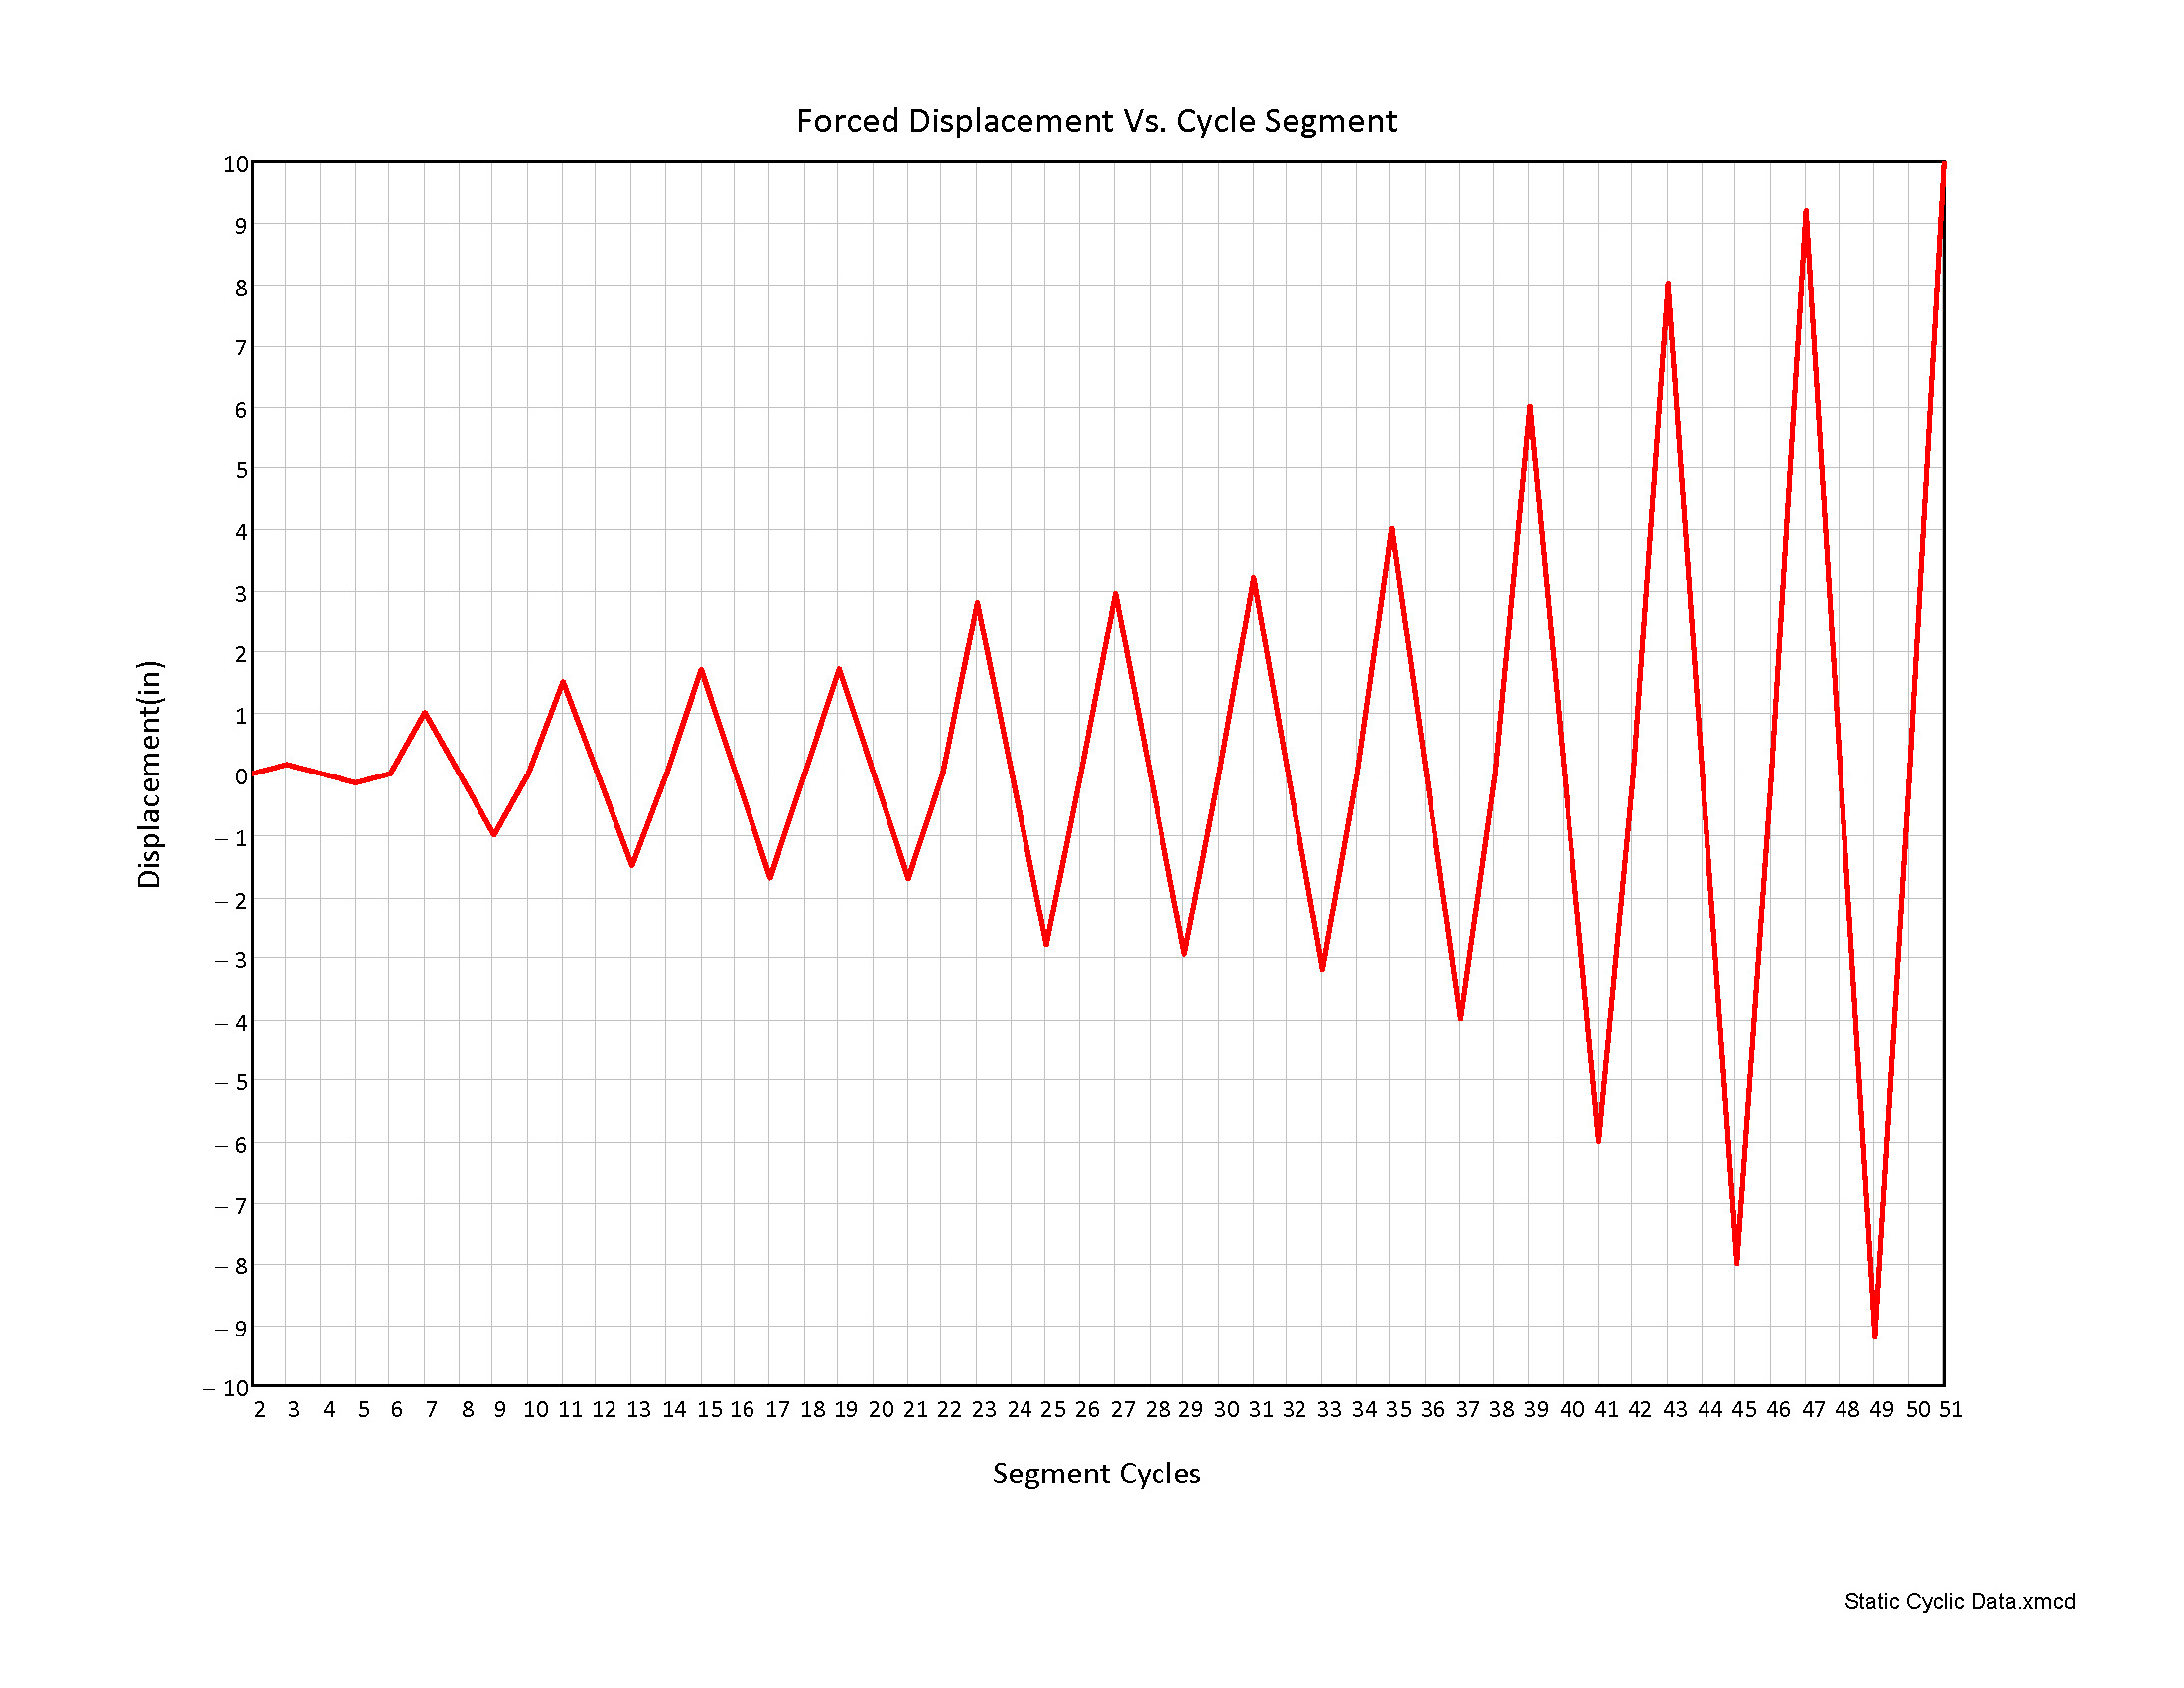
Say I have a set of data as such,
| 2 | 0 |
| 3 | 0.15 |
| 4 | 0 |
| 5 | -0.15 |
| 6 | 0 |
| 7 | 1 |
| 8 | 0 |
| 9 | -1 |
| 10 | 0 |
| 11 | 1.5 |
| 12 | 0 |
| 13 | -1.5 |
| 14 | 0 |
| 15 | 1.7 |
| 16 | 0 |
| 17 | -1.7 |
| 18 | 0 |
| 19 | 1.71 |
| 20 | 0 |
| 21 | -1.71 |
| 22 | 0 |
| 23 | 2.8 |
| 24 | 0 |
| 25 | -2.8 |
| 26 | 0 |
| 27 | 2.95 |
| 28 | 0 |
| 29 | -2.95 |
| 30 | 0 |
| 31 | 3.2 |
| 32 | 0 |
| 33 | -3.2 |
| 34 | 0 |
| 35 | 4 |
| 36 | 0 |
| 37 | -4 |
| 38 | 0 |
| 39 | 6 |
| 40 | 0 |
| 41 | -6 |
| 42 | 0 |
| 43 | 8 |
| 44 | 0 |
| 45 | -8 |
| 46 | 0 |
| 47 | 9.2 |
| 48 | 0 |
| 49 | -9.2 |
| 50 | 0 |
| 51 | 10 |
How do I take this data and animate?
Apr 07, 2015
05:41 PM
- Mark as New
- Bookmark
- Subscribe
- Mute
- Subscribe to RSS Feed
- Permalink
- Notify Moderator
Please log in to access translation
Apr 07, 2015
05:41 PM
Which version of Mathcad do you have?
What do you want to animate? Do you want to show one point on a graph that starts at 2, 0, then moves to 3, 0.15, etc?
Apr 07, 2015
05:53 PM
- Mark as New
- Bookmark
- Subscribe
- Mute
- Subscribe to RSS Feed
- Permalink
- Notify Moderator
Please log in to access translation
Apr 07, 2015
05:53 PM
I have 14 in my personal laptop and 15 at work computer.
You are correct, start 2,0 then 3,0.15 and so on.
Final graph below.
I also have a larger file with a-lot more data but if I can do this one, the larger one should not be a problem.
Apr 07, 2015
06:17 PM
- Mark as New
- Bookmark
- Subscribe
- Mute
- Subscribe to RSS Feed
- Permalink
- Notify Moderator
Please log in to access translation
Apr 07, 2015
06:52 PM
- Mark as New
- Bookmark
- Subscribe
- Mute
- Subscribe to RSS Feed
- Permalink
- Notify Moderator
Please log in to access translation
Apr 07, 2015
06:52 PM
Thank you Richard, this is exactly what I was looking for. I will be in contact if the larger file does not work.
Apr 07, 2015
07:51 PM
- Mark as New
- Bookmark
- Subscribe
- Mute
- Subscribe to RSS Feed
- Permalink
- Notify Moderator
Please log in to access translation
Apr 07, 2015
07:51 PM
Richard,
What if you have 10,000 or more rows of data? How do you animate?
Apr 07, 2015
09:46 PM
- Mark as New
- Bookmark
- Subscribe
- Mute
- Subscribe to RSS Feed
- Permalink
- Notify Moderator
Please log in to access translation
Apr 07, 2015
09:46 PM
You need a high frame rate.
Apr 07, 2015
09:52 PM
- Mark as New
- Bookmark
- Subscribe
- Mute
- Subscribe to RSS Feed
- Permalink
- Notify Moderator
Please log in to access translation
Apr 07, 2015
09:52 PM
Got it, thank you.


