Community Tip - Need to share some code when posting a question or reply? Make sure to use the "Insert code sample" menu option. Learn more! X
- Subscribe to RSS Feed
- Mark Topic as New
- Mark Topic as Read
- Float this Topic for Current User
- Bookmark
- Subscribe
- Mute
- Printer Friendly Page
Argand diagram
- Mark as New
- Bookmark
- Subscribe
- Mute
- Subscribe to RSS Feed
- Permalink
- Notify Moderator
Argand diagram
Hello there.
Here I am again!
I've really been searching on this subject, but I can't seem to find out how.
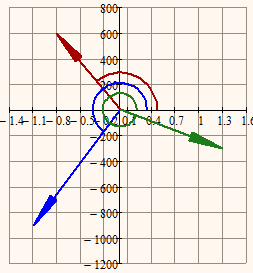
In this arganddiagram (I've found it on the internet)
A line is drawn from the origin, to the coordinate, and the angle has been drawn too.
How do you do this (either in MC15 or prime) - It would really be great, as I have an exam on the subject monday :-)!
Thank you,
Ben
- Mark as New
- Bookmark
- Subscribe
- Mute
- Subscribe to RSS Feed
- Permalink
- Notify Moderator
In as much would the ability to misuse Mathcad as a drawing program help for your exam?
The picture you show may gave been created with Mathcad and then modified using any drawing prog.
It sure is very easy to draw the line segment in Mathcad and with a little work you will also be able to draw the circular arc and even an arrowhead. Ther problem here is the scaling. How long should the arrow head be, what radius should the circle have? Always 1? Or rather always 20% of the magnitude of the complex number shown? And if you don't (can) use equal scales in your plot, the circle will be an ellipse and the arrowhead will look distorted.
Furthermore it would be really very difficult to add automatic labelling, writing "arc(z)" next to the arc and "|z|" next to the line (look at the "Amazing Images.." e.book for things like that.
So unless there isn't any special need you didn't mention, just use your favorite drawing program to create an illistration of the Gauß plane.
- Mark as New
- Bookmark
- Subscribe
- Mute
- Subscribe to RSS Feed
- Permalink
- Notify Moderator
I see what you mean. Thank you again 🙂
- Mark as New
- Bookmark
- Subscribe
- Mute
- Subscribe to RSS Feed
- Permalink
- Notify Moderator
Have just modified an older sheet of mine and added support for scaling, the way how to measure the angle, length of arrow head in "real" units for printing or onscreen, radius of arc, etc. Not yet fully tested and documented but you may give it a testdrive.
Also created an animation, but normally I would omit the arcs here.

- Mark as New
- Bookmark
- Subscribe
- Mute
- Subscribe to RSS Feed
- Permalink
- Notify Moderator
Wauw, pretty amazing.
I'll sure try to work a little with that, and try to get the idea! You sure are a smart man 😉


