
Turn on suggestions
Auto-suggest helps you quickly narrow down your search results by suggesting possible matches as you type.
Showing results for
Please log in to access translation
Turn on suggestions
Auto-suggest helps you quickly narrow down your search results by suggesting possible matches as you type.
Showing results for
Community Tip - Did you get an answer that solved your problem? Please mark it as an Accepted Solution so others with the same problem can find the answer easily. X
Translate the entire conversation x
Please log in to access translation
Options
- Subscribe to RSS Feed
- Mark Topic as New
- Mark Topic as Read
- Float this Topic for Current User
- Bookmark
- Subscribe
- Mute
- Printer Friendly Page
Axis Expressions
Jun 14, 2018
06:21 AM
- Mark as New
- Bookmark
- Subscribe
- Mute
- Subscribe to RSS Feed
- Permalink
- Notify Moderator
Please log in to access translation
Jun 14, 2018
06:21 AM
Axis Expressions
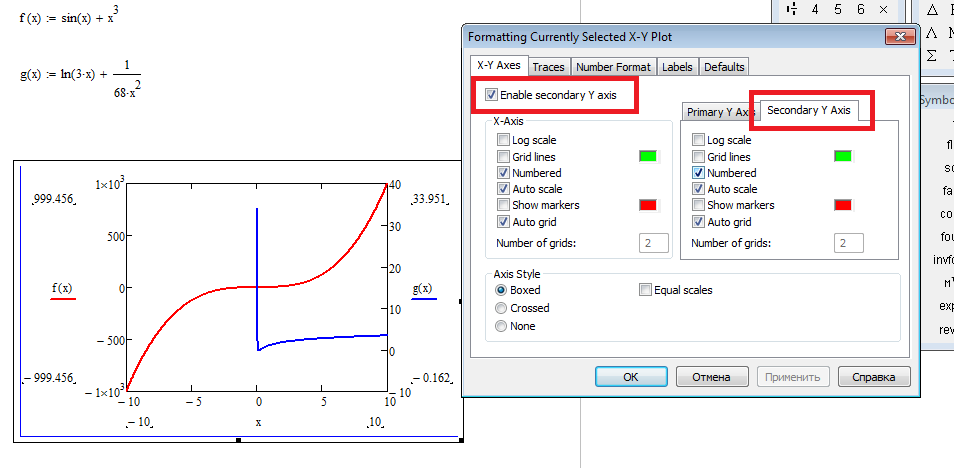
Simple one, does anyone know if it is possible to plot two datasets with vary different scales and display two different scales? i.e. have two differing y axis scales? You often see graphs with one scale to the left and one to the right each with their scale and units respectively. Wondering if MC can handle this?
Cheers,
Andy
Solved! Go to Solution.
Labels:
- Labels:
-
Statistics_Analysis
ACCEPTED SOLUTION
Accepted Solutions
Jun 14, 2018
06:49 AM
- Mark as New
- Bookmark
- Subscribe
- Mute
- Subscribe to RSS Feed
- Permalink
- Notify Moderator
Please log in to access translation
Jun 14, 2018
06:49 AM
@awibroe wrote:
Simple one, does anyone know if it is possible to plot two datasets with vary different scales and display two different scales? i.e. have two differing y axis scales? You often see graphs with one scale to the left and one to the right each with their scale and units respectively. Wondering if MC can handle this?
Cheers,
Andy
Mathcad 15 can.
Prime (up to 4.0 at least) cannot
3 REPLIES 3
Jun 14, 2018
06:49 AM
- Mark as New
- Bookmark
- Subscribe
- Mute
- Subscribe to RSS Feed
- Permalink
- Notify Moderator
Please log in to access translation
Jun 14, 2018
06:49 AM
@awibroe wrote:
Simple one, does anyone know if it is possible to plot two datasets with vary different scales and display two different scales? i.e. have two differing y axis scales? You often see graphs with one scale to the left and one to the right each with their scale and units respectively. Wondering if MC can handle this?
Cheers,
Andy
Mathcad 15 can.
Prime (up to 4.0 at least) cannot
Jun 14, 2018
06:50 AM
- Mark as New
- Bookmark
- Subscribe
- Mute
- Subscribe to RSS Feed
- Permalink
- Notify Moderator
Please log in to access translation
Jun 14, 2018
06:50 AM
Thanks Fred!
Jun 15, 2018
09:56 AM
- Mark as New
- Bookmark
- Subscribe
- Mute
- Subscribe to RSS Feed
- Permalink
- Notify Moderator
Please log in to access translation


