Community Tip - Stay updated on what is happening on the PTC Community by subscribing to PTC Community Announcements. X
- Subscribe to RSS Feed
- Mark Topic as New
- Mark Topic as Read
- Float this Topic for Current User
- Bookmark
- Subscribe
- Mute
- Printer Friendly Page
Best Smoothing Approach
- Mark as New
- Bookmark
- Subscribe
- Mute
- Subscribe to RSS Feed
- Permalink
- Notify Moderator
Best Smoothing Approach
Hi
Help with smoothing function please.
I am having issues formulation a smoothing function. Errors like "This value must be a vector of real numbers: pop up.
A working example will help a lot.
Prime 6 File Attached.
Solved! Go to Solution.
Accepted Solutions
- Mark as New
- Bookmark
- Subscribe
- Mute
- Subscribe to RSS Feed
- Permalink
- Notify Moderator
l having problems plotting.
Mathcad and Excel file attached for your help please.
- Tags:
- smoothing
- Mark as New
- Bookmark
- Subscribe
- Mute
- Subscribe to RSS Feed
- Permalink
- Notify Moderator
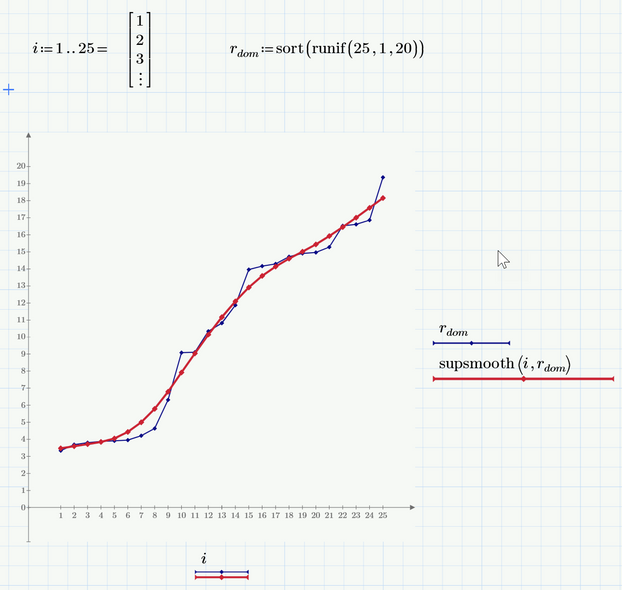
Your approach failed because i is not a vector but a range!
In the pic below I used an undocumented trick to turn a range into a vector by adding a numeric evaluation when defining the variable i. Furthermore I chose the first value to be 1 instead of zero so the magnitude of i and r.dom match.
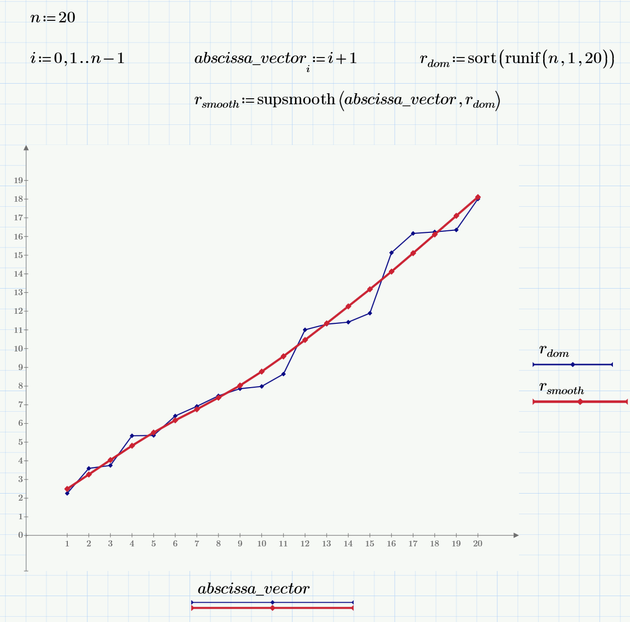
But of course you are on the save side if you define the necessary vector the "legal" way:
A working example can also be found in the help
You may also be interested in the information about smoothing in the MC15 help. Find it converted to pdf in the attachments.
- Mark as New
- Bookmark
- Subscribe
- Mute
- Subscribe to RSS Feed
- Permalink
- Notify Moderator
Is it possible to integrate the supsmooth function?
- Mark as New
- Bookmark
- Subscribe
- Mute
- Subscribe to RSS Feed
- Permalink
- Notify Moderator
@DJF wrote:
Is it possible to integrate the supsmooth function?
supsmooth does not return a function but rather a vector of y-values corresponding to the vector of x-values provided.
You either can write your own "integration" function which works on datapoints given by vectors or you use interpolation (either linear or cubic splines) to turn the result of supsmooth into a function.
- Mark as New
- Bookmark
- Subscribe
- Mute
- Subscribe to RSS Feed
- Permalink
- Notify Moderator
A function for the supsmooth can be defined using the x and y vectors with interp function. This new function can be integrated.
- Mark as New
- Bookmark
- Subscribe
- Mute
- Subscribe to RSS Feed
- Permalink
- Notify Moderator
I see. So, then no real advantage to using supsmooth over say a b-spline (unless you happen to like the fit better). was hoping to save a step. Thanks all.
- Mark as New
- Bookmark
- Subscribe
- Mute
- Subscribe to RSS Feed
- Permalink
- Notify Moderator
l having problems plotting.
Mathcad and Excel file attached for your help please.
- Tags:
- smoothing
- Mark as New
- Bookmark
- Subscribe
- Mute
- Subscribe to RSS Feed
- Permalink
- Notify Moderator
What's the problem...it plots
doesn't it?
Luc
- Mark as New
- Bookmark
- Subscribe
- Mute
- Subscribe to RSS Feed
- Permalink
- Notify Moderator
Sorry wasn’t clear. Can’t plot the smoothed data.
- Mark as New
- Bookmark
- Subscribe
- Mute
- Subscribe to RSS Feed
- Permalink
- Notify Moderator
I don't see any attempt to plot r.smooth ??
Maybe you just have to move down the plot below the definition of r.smooth?
- Mark as New
- Bookmark
- Subscribe
- Mute
- Subscribe to RSS Feed
- Permalink
- Notify Moderator
Thanks!
- Mark as New
- Bookmark
- Subscribe
- Mute
- Subscribe to RSS Feed
- Permalink
- Notify Moderator
An additional remark:
It looks like you got confused by the indexing of vectors. By default Prime starts with zero.
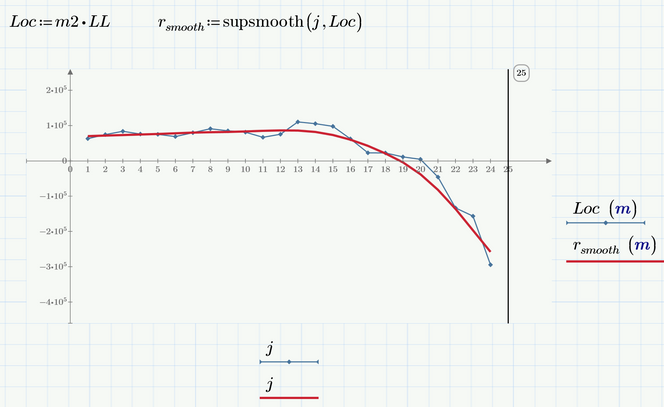
You defined your range i starting from 1 and then plotted Loc[i over i. That way your plot gets shifted to the left for 1 unit - the first value of your data vector "Loc" is ignored and the second one (index 1) is assigned to 1, etc.
Correct plot should look that way:
- Mark as New
- Bookmark
- Subscribe
- Mute
- Subscribe to RSS Feed
- Permalink
- Notify Moderator
Thanks for spotting that.


