Community Tip - Need to share some code when posting a question or reply? Make sure to use the "Insert code sample" menu option. Learn more! X
- Subscribe to RSS Feed
- Mark Topic as New
- Mark Topic as Read
- Float this Topic for Current User
- Bookmark
- Subscribe
- Mute
- Printer Friendly Page
Bode Plot from given Transfer Function in Mathcad Prime 13.0
- Mark as New
- Bookmark
- Subscribe
- Mute
- Subscribe to RSS Feed
- Permalink
- Notify Moderator
Bode Plot from given Transfer Function in Mathcad Prime 13.0
Hello Everyone
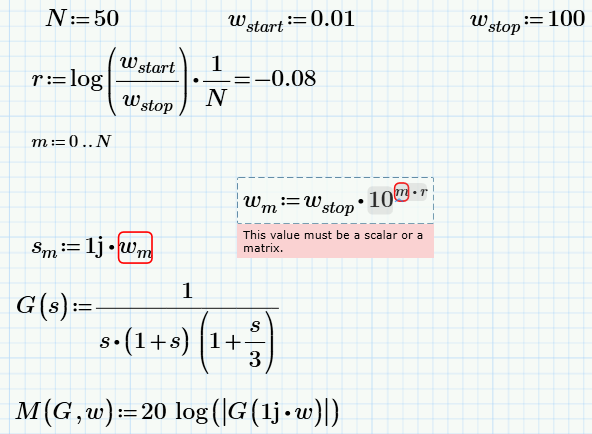
I am new in Mathcad. I would like to plot "Bode Plot" from the given transfer function. I followed one of the attached reference ,but i stucked in between. Please help in this regard.
Please tell me if any other simplest way exist to do so.
Solved! Go to Solution.
Accepted Solutions
- Mark as New
- Bookmark
- Subscribe
- Mute
- Subscribe to RSS Feed
- Permalink
- Notify Moderator
AlvaroDíaz wrote:
Sorry, can't tell you why, but I only rewrite your expressions, and then works. But have not idea why.
It's a sneaky one, Alvaro; one of the commonest errors that can't be easily diagnosed from a picture and needs a careful look even with a worksheet. sm is a literal subscript not an index. Note how the "Subscript" button highlights in the Style ribbon. The definition on the right has m as a vector index; it is slightly lower than the literal version of m but not sufficiently to make it clear. I'm not sure that it's worth the effort of lowering the index (given that the Subscript button highlights) ; I prefer the look of the literal subscript position anyway - it's just one more ambiguity in standard math notation and I'd prefer Mathcad (and other applications) to stick to the ISO (or, at least, have an option for strict ISO)..

Stuart
- Mark as New
- Bookmark
- Subscribe
- Mute
- Subscribe to RSS Feed
- Permalink
- Notify Moderator
Sorry, can't tell you why, but I only rewrite your expressions, and then works. But have not idea why. Hope that the attached works in your computer.
Regards.
- Mark as New
- Bookmark
- Subscribe
- Mute
- Subscribe to RSS Feed
- Permalink
- Notify Moderator
AlvaroDíaz wrote:
Sorry, can't tell you why, but I only rewrite your expressions, and then works. But have not idea why.
It's a sneaky one, Alvaro; one of the commonest errors that can't be easily diagnosed from a picture and needs a careful look even with a worksheet. sm is a literal subscript not an index. Note how the "Subscript" button highlights in the Style ribbon. The definition on the right has m as a vector index; it is slightly lower than the literal version of m but not sufficiently to make it clear. I'm not sure that it's worth the effort of lowering the index (given that the Subscript button highlights) ; I prefer the look of the literal subscript position anyway - it's just one more ambiguity in standard math notation and I'd prefer Mathcad (and other applications) to stick to the ISO (or, at least, have an option for strict ISO)..

Stuart
- Mark as New
- Bookmark
- Subscribe
- Mute
- Subscribe to RSS Feed
- Permalink
- Notify Moderator
Wow. With Prime I feel like working with a hammer for clean glasses. I check if was that but can't found any visual difference when editing. And, I like the rubber minimized. MC6 have more options than prime.
- Mark as New
- Bookmark
- Subscribe
- Mute
- Subscribe to RSS Feed
- Permalink
- Notify Moderator
AlvaroDíaz wrote:
Wow. With Prime I feel like working with a hammer for clean glasses. I check if was that but can't found any visual difference when editing. And, I like the rubber minimized. MC6 have more options than prime.
I know how you feel, Alvaro. I normally work with the ribbon minimized as well, but in this case I opened it up because I was wondering if there a Style difference between the various "m"s. The difference between "Subscript" and index is visually subtle, but there once you know what to look for: a name subscript isn't completely below the "main" part of the name, whereas an index is below it (descending parts of a letter excluded).
Yes, we could certainly do with restoration of a few options in Prime.
However, there are few things that Prime's UI is better at and I soon work out which they are when I find myself looking for them in M15. The Region colour and nested array display buttons are a couple of examples .. oh, and control-J for entering programming keywords - that I really do like! And, of course, matrix entry is *so* much easier that I'm even starting to use it in places where I'd use stack or augment statements previously.
Now I've noticed the "Subscript" button highlighting, I'll probably make that a first port of call for possible index errors.
Stuart
- Mark as New
- Bookmark
- Subscribe
- Mute
- Subscribe to RSS Feed
- Permalink
- Notify Moderator
I'm not one that usually has much praise for Prime, but the difference between the subscripts is even more subtle in MC15 (almost invisible if the cursor is not in the expression)
MC15:


Prime:


- Mark as New
- Bookmark
- Subscribe
- Mute
- Subscribe to RSS Feed
- Permalink
- Notify Moderator
Richard Jackson wrote:
I'm not one that usually has much praise for Prime, but the difference between the subscripts is even more subtle in MC15 (almost invisible if the cursor is not in the expression)
I agree, and I imagine that trying to make the distinction more obvious is one of the reasons that PTC changed the layout.

However, for normal scales it still takes a sharp eye to *notice* the difference, especially if one *knows* what the expression is supposed to be doing (it took me about minute of gazing at it to figure out what the problem was). Which means that it possibly isn't worth the effort and only ends up making indices look slightly awkward and increases the amount of vertical space that expressions take (and programs already eat up more than they need).
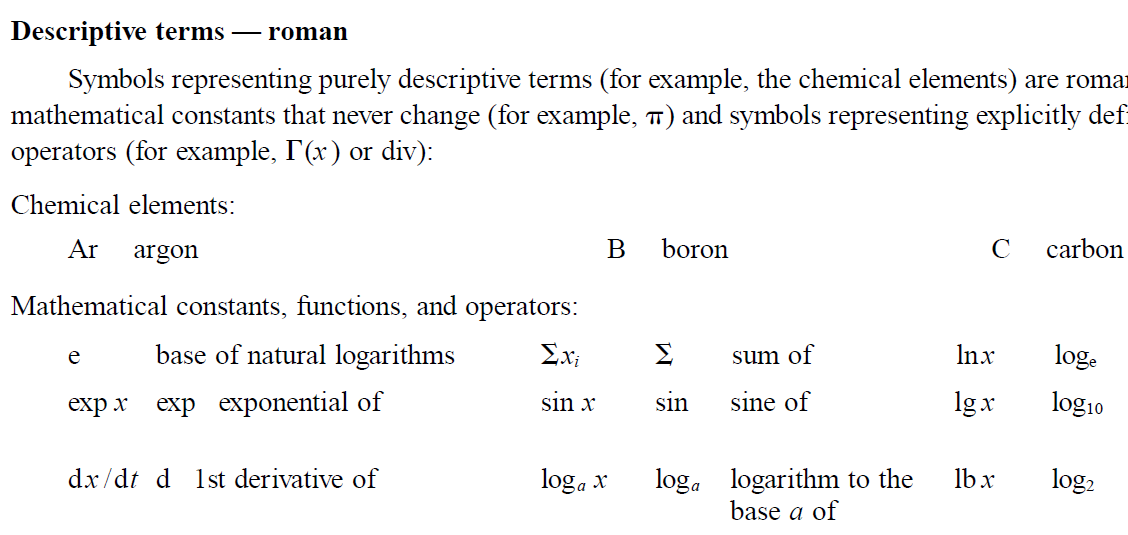
I haven't yet found a standard that makes any distinction between a descriptive subscript and an indicial one, except in the matter of typeface, where the convention is that descriptive subscripts should be in roman (upright) font whilst indicial ones should be in italic (eg, http://www.physics.nist.gov/cuu/pdf/typefaces.pdf). So if PTC want to take note of the standards, then they should put all subscripts at the same level and make the descriptive subscripts Roman. In the example below, from the referenced NIST document, the subscript a in loga is italic because it's a variable, but the e loge is roman because it's descriptive.
Stuart
- Mark as New
- Bookmark
- Subscribe
- Mute
- Subscribe to RSS Feed
- Permalink
- Notify Moderator
Unfortunately, I don't think PTC (or Mathsoft before them) bothered to look at what any standards may suggest. That's a pity, because when stuff makes it into a standard it's usually because someone (or many someones) has put a lot of thought into it.
- Mark as New
- Bookmark
- Subscribe
- Mute
- Subscribe to RSS Feed
- Permalink
- Notify Moderator
Richard Jackson wrote:
Unfortunately, I don't think PTC (or Mathsoft before them) bothered to look at what any standards may suggest. That's a pity, because when stuff makes it into a standard it's usually because someone (or many someones) has put a lot of thought into it.
I don't know about PTC, but I do know that Mathsoft did make some effort to conform with some of the standards; I think Leslie used to attend the MathML working groups and I vaguely recollect Allen Razdow saying he had had several meetings with NIST to ensure Mathcad conformed to something or other.
Stuart
- Mark as New
- Bookmark
- Subscribe
- Mute
- Subscribe to RSS Feed
- Permalink
- Notify Moderator
Perhaps I misjudge them then. Guilty until proven innocent is what I say though ![]()
- Mark as New
- Bookmark
- Subscribe
- Mute
- Subscribe to RSS Feed
- Permalink
- Notify Moderator
Richard Jackson wrote:
Perhaps I misjudge them then. Guilty until proven innocent is what I say though
You are Judge Dredd and I demand my £5. ![]()

... that's an idea. Maybe we could lock up the developers in an IsoCube until we get MDAs. ![]()
- Mark as New
- Bookmark
- Subscribe
- Mute
- Subscribe to RSS Feed
- Permalink
- Notify Moderator
Hi Stuart
Thanks for your interest. I got what mistake i had done. I substituted m as a subscript but it should be in vector(M() option under Operation Tag in Menu). As i told i have been through one reference, I am not getting why exactly these complicated variables (N,r, wstart,wstop) they have used just for freq range. I can simply give using W=10,10...100. Can you please clarify for the same.
Also the bode plot should be in log scale..I mean X axis should be like 0.1,10,10^2,10^3....but I am getting something different.Please help in this regard.
- Mark as New
- Bookmark
- Subscribe
- Mute
- Subscribe to RSS Feed
- Permalink
- Notify Moderator
SAMEER GARG wrote:
Hi Stuart
Thanks for your interest. I got what mistake i had done. I substituted m as a subscript but it should be in vector(M() option under Operation Tag in Menu). As i told i have been through one reference, I am not getting why exactly these complicated variables (N,r, wstart,wstop) they have used just for freq range. I can simply give using W=10,10...100. Can you please clarify for the same.
Hi Sameer,
The reason is that it's easier to change an individual variable than modify the range variable. In addition, you might want to use those variables elsewhere (eg, when limiting the plot ranges or testing the values at the end points).
The best reason, though, is probably maintainability and reuse. It's often easier for others using your worksheet (or even yourself at some future date ... like about 10 mins later if you're anything like me! ![]() ) to work out what the 10 and 100 mean when they first start looking at the worksheet. You can also easily grab the whole set of equations across and use them in a different problem with a different range of values, and only worry about changing them once - job done!
) to work out what the 10 and 100 mean when they first start looking at the worksheet. You can also easily grab the whole set of equations across and use them in a different problem with a different range of values, and only worry about changing them once - job done!
On a Mathcad technical side, you wouldn't want w to be a range variable anyway. Only use range variables for iteration (where you generally want an integer) or for one-offs, otherwise use vectors; you can perform mathematical operations on a vector but you can't on a range variable.
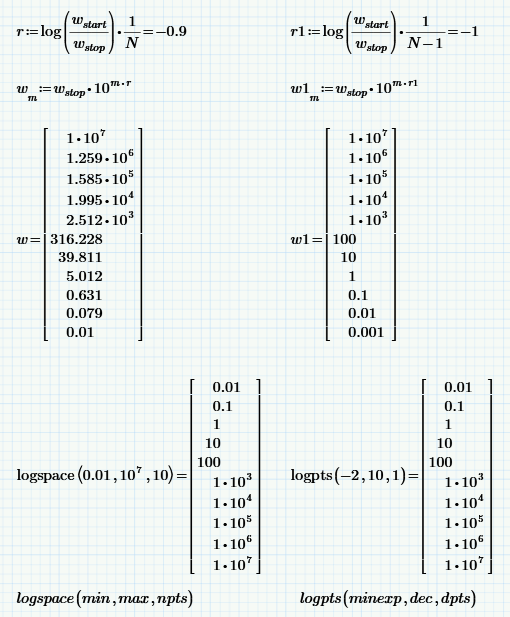
In terms of the problem itself, I suspect that the expression for r should 1/(N-1) not 1/N - you get a proper decade log scale then. It's also worth looking up the logspace and logpts function, as they can make life easier for applications like this.
Also the bode plot should be in log scale..I mean X axis should be like 0.1,10,10^2,10^3....but I am getting something different.Please help in this regard.
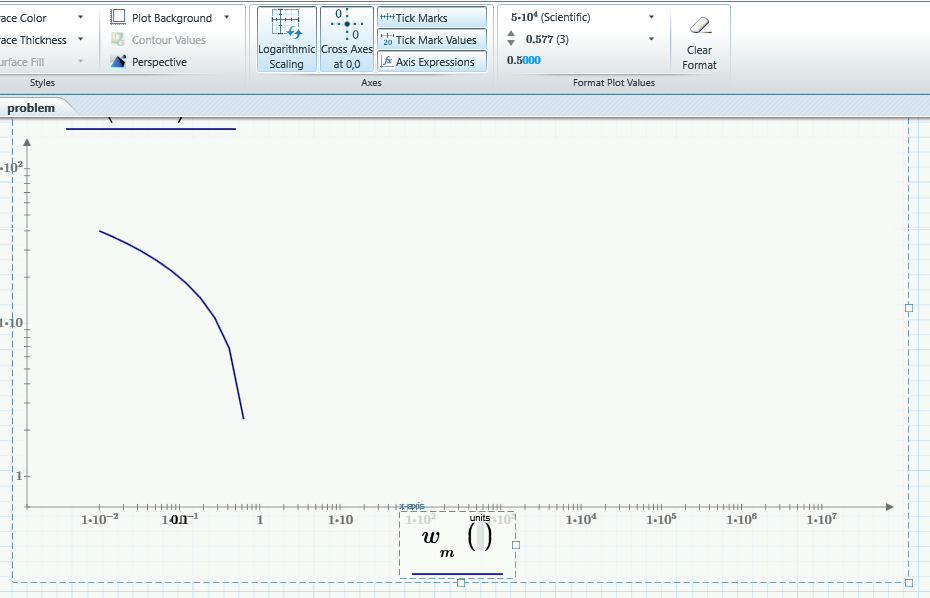
In Prime 3.1, you need to click on each axis in turn and then choose Logarithmic scaling.
Stuart
- Mark as New
- Bookmark
- Subscribe
- Mute
- Subscribe to RSS Feed
- Permalink
- Notify Moderator
Hello Stuart
I used attached template for drawing bode plot from many transfer function & I got expected results as well. Can you please tell me what mistake i have done for this transfer function
- Mark as New
- Bookmark
- Subscribe
- Mute
- Subscribe to RSS Feed
- Permalink
- Notify Moderator
Hello, Sgarg! regard to the "Nichols Chart" you could download the worksheet (Nichols Chart.xmcd) present on the second page of this community and try to import it into "PRIME 3.1". Success is not assured.
- Mark as New
- Bookmark
- Subscribe
- Mute
- Subscribe to RSS Feed
- Permalink
- Notify Moderator
Ah,
and all I see is that you appear/seem to be working with a version of Prime that I guess even PTC is only dreaming of......13.![]()
Luc
- Mark as New
- Bookmark
- Subscribe
- Mute
- Subscribe to RSS Feed
- Permalink
- Notify Moderator
![]()
![]()
![]()
![]()
- Mark as New
- Bookmark
- Subscribe
- Mute
- Subscribe to RSS Feed
- Permalink
- Notify Moderator
Hello Everyone
I have been through all suggestions. On that example it was working find but attached example its not working and again some error is coming. Please help me in this regard.<<Please see attached Problem1>>
Also I would like to make w_start and w_stop with Hz as a unit. When i used to do so i was getting an error.<<Please see attached problem2>>
- Mark as New
- Bookmark
- Subscribe
- Mute
- Subscribe to RSS Feed
- Permalink
- Notify Moderator
SAMEER GARG wrote:
Hello Everyone
I have been through all suggestions. On that example it was working find but attached example its not working and again some error is coming. Please help me in this regard.<<Please see attached Problem1>>
Problem 1 is actually corrected by adding units to wstart and wstop.

Just as an aside, whilst the wm method works well in Mathcad, it might be slightly less meaningful to an average (but domain-literate) reader. It would be nicer to drop the indices and just have M(g,w) and w on the axes. You can achieve this by making M and P automatically vectorize their arguments.

Also I would like to make w_start and w_stop with Hz as a unit. When i used to do so i was getting an error.<<Please see attached problem2>>
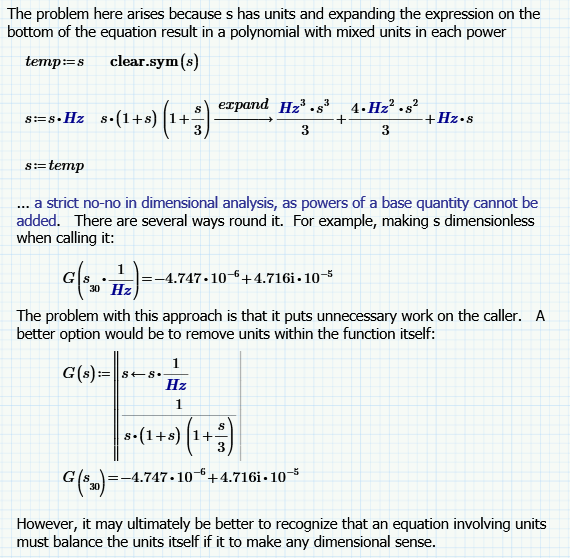
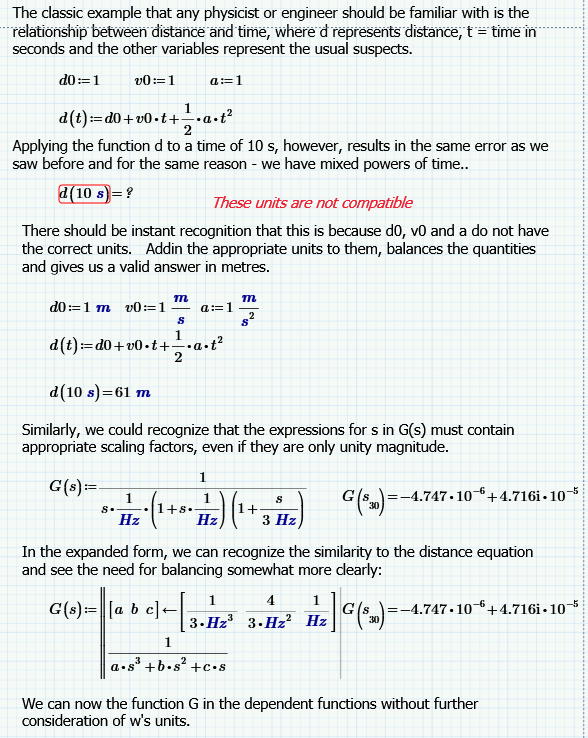
Your new expression for G(s) contains a polynomial in s, which when expanded will result in an equation that has mixed powers of Hz. Dimensionally, this is disallowed as you cannot add seconds to seconds-squared. There are several ways of dealing with this: divide s by Hz when calling the G, divide s by Hz inside G and then apply the expression , divide each s in the expression by Hz, or expand the polynomial and divide each power of s by the appropriate power of Hz. See the attached worksheet.
Stuart
- Mark as New
- Bookmark
- Subscribe
- Mute
- Subscribe to RSS Feed
- Permalink
- Notify Moderator
Hi
Thanks a lot for valuable response. As per your suggestion i used to call the function from the plot with taking care of dimension. In lott of problem it worked fine but i am unable to proceed for given transfer function. Please help what exactly I have to do, @to take care of?
- Mark as New
- Bookmark
- Subscribe
- Mute
- Subscribe to RSS Feed
- Permalink
- Notify Moderator
SAMEER GARG wrote:
Hi
Thanks a lot for valuable response. As per your suggestion i used to call the function from the plot with taking care of dimension. In lott of problem it worked fine but i am unable to proceed for given transfer function. Please help what exactly I have to do, @to take care of?
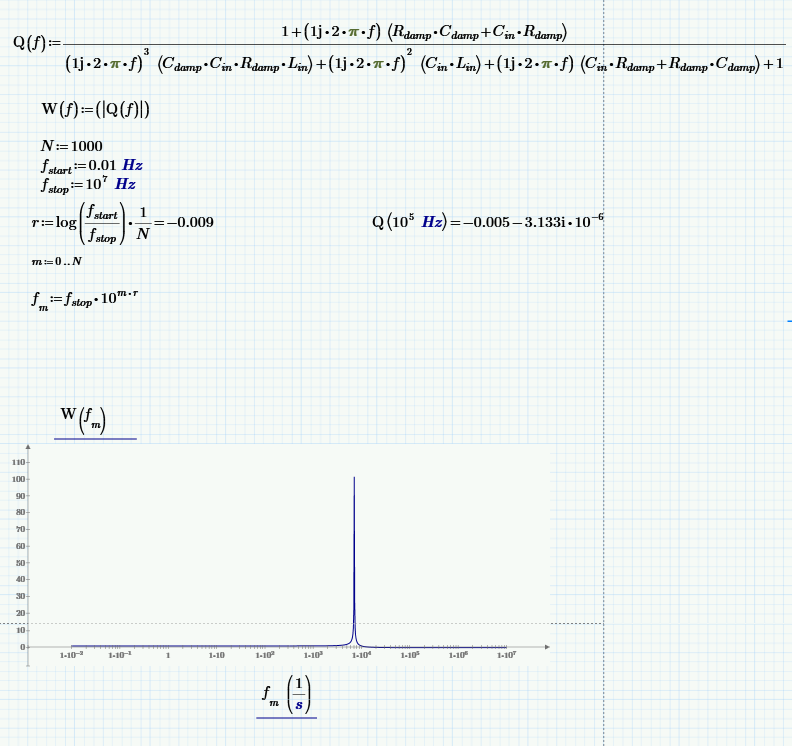
Look to the units! The Error Tracing facility points you back to an incompatible unit error - you've got RC+CC.

I don't know whether it's what you want, but I changed one of the capacitances to be Rdamp (and in the expression on the denominator) and this at least fixes the problem. You need to leave the units in the W(fm) expression, otherwise Q(f) becomes dimensionally inconsistent.
Stuart
- Mark as New
- Bookmark
- Subscribe
- Mute
- Subscribe to RSS Feed
- Permalink
- Notify Moderator
Hello Stuart
Thanks a ton![]() . Finally i done with. There was a mistake in transfer function calculation. I solved that again and i got finally my expected result.
. Finally i done with. There was a mistake in transfer function calculation. I solved that again and i got finally my expected result.![]() . Thank God from now onwords I will not confuse between subscript and Vector and also dimension consideration on plotting.
. Thank God from now onwords I will not confuse between subscript and Vector and also dimension consideration on plotting.
- Mark as New
- Bookmark
- Subscribe
- Mute
- Subscribe to RSS Feed
- Permalink
- Notify Moderator
SAMEER GARG wrote:
Hello Stuart
Thanks a ton. Finally i done with. There was a mistake in transfer function calculation. I solved that again and i got finally my expected result.. Thank God
Excellent. ![]()
from now onwords I will not confuse between subscript and Vector and also dimension consideration on plotting.
Oh yes you will. ![]() The only reason we have fingers is to type the wrong thing, and the only reason we have brains is to remember to do all the things we said we never would.
The only reason we have fingers is to type the wrong thing, and the only reason we have brains is to remember to do all the things we said we never would.
http://www.murphys-laws.com/murphy/murphy-laws.html
Stuart
- Mark as New
- Bookmark
- Subscribe
- Mute
- Subscribe to RSS Feed
- Permalink
- Notify Moderator
Hello Stuart
Thanks a ton![]() . Finally i done with. There was a mistake in transfer function calculation. I solved that again and i got finally my expected result.
. Finally i done with. There was a mistake in transfer function calculation. I solved that again and i got finally my expected result.![]() . Thank God from now onwords I will not confuse between subscript and Vector and also dimension consideration on plotting.
. Thank God from now onwords I will not confuse between subscript and Vector and also dimension consideration on plotting.
- Mark as New
- Bookmark
- Subscribe
- Mute
- Subscribe to RSS Feed
- Permalink
- Notify Moderator
Hello Sameer!
I also use for the first time mathcad PRIME 3.1.
I would solve your problem as shown in the attached file.


