
Turn on suggestions
Auto-suggest helps you quickly narrow down your search results by suggesting possible matches as you type.
Showing results for
Please log in to access translation
Turn on suggestions
Auto-suggest helps you quickly narrow down your search results by suggesting possible matches as you type.
Showing results for
Community Tip - Learn all about PTC Community Badges. Engage with PTC and see how many you can earn! X
Translate the entire conversation x
Please log in to access translation
Options
- Subscribe to RSS Feed
- Mark Topic as New
- Mark Topic as Read
- Float this Topic for Current User
- Bookmark
- Subscribe
- Mute
- Printer Friendly Page
Can I use Polyroots in a in a loop ?
Apr 29, 2016
04:23 AM
- Mark as New
- Bookmark
- Subscribe
- Mute
- Subscribe to RSS Feed
- Permalink
- Notify Moderator
Please log in to access translation
Apr 29, 2016
04:23 AM
Can I use Polyroots in a in a loop ?
Hi, I am wishing to solve a Hertzian contact problem for sub-surface stresses for multiple points in order to plot contours. The solution routine uses Polyroots to extract the maximum root for use in the calculation and works fine for a single point. Is it possible to automate the process in a loop for variable x, y and z using Polyroots? I tried a couple of attempts but get errors.
Any assistance would be appreciated.
Thanks Ross
Labels:
- Labels:
-
Other
31 REPLIES 31
Apr 29, 2016
05:19 AM
- Mark as New
- Bookmark
- Subscribe
- Mute
- Subscribe to RSS Feed
- Permalink
- Notify Moderator
Please log in to access translation
Apr 29, 2016
05:19 AM
Ross Emslie wrote:
Hi, I am wishing to solve a Hertzian contact problem for sub-surface stresses for multiple points in order to plot contours. The solution routine uses Polyroots to extract the maximum root for use in the calculation and works fine for a single point. Is it possible to automate the process in a loop for variable x, y and z using Polyroots? I tried a couple of attempts but get errors.
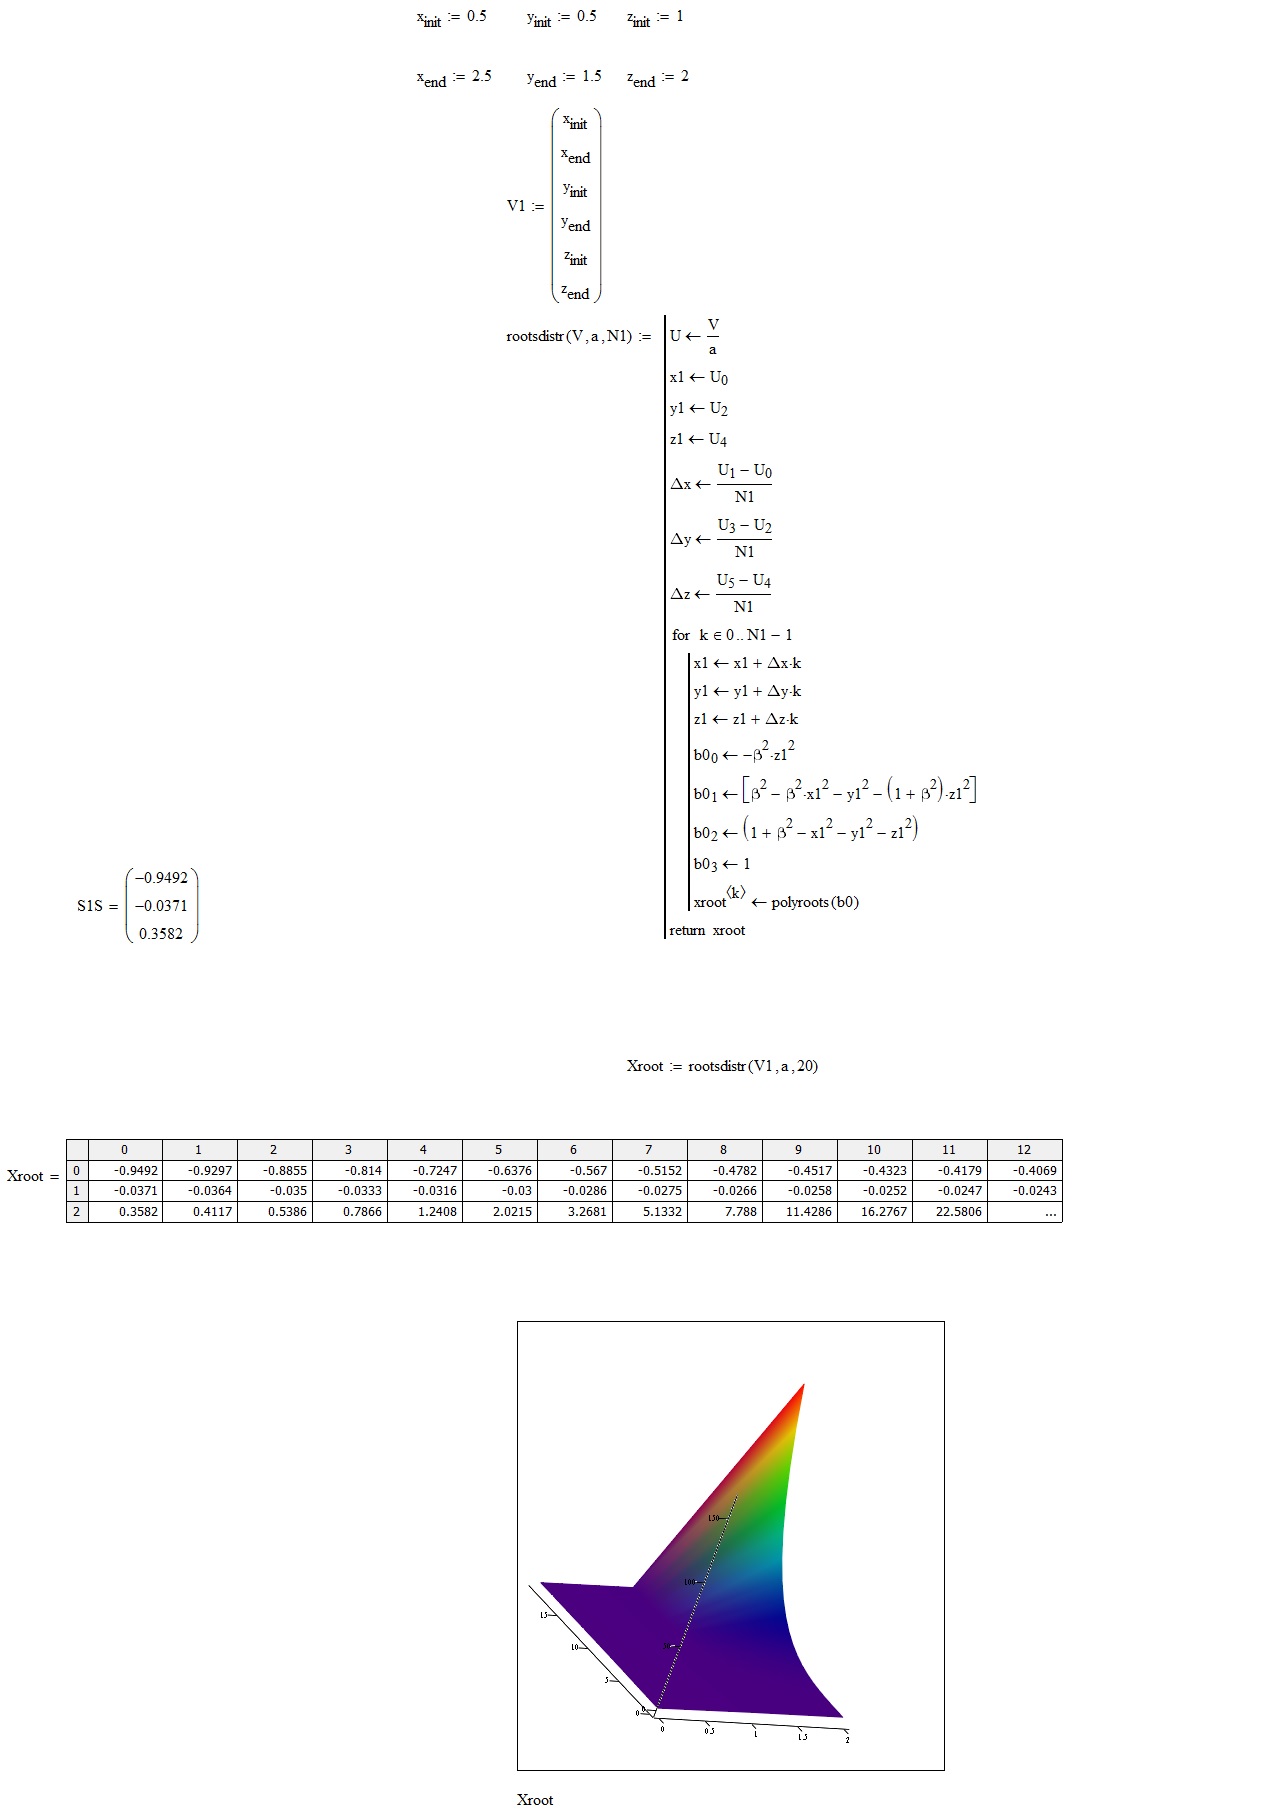
I'm not sure you need to use the symbolic processor as you already know the form of the polynomial. You should be able to wrap the S1S equations up into a function like this ...

which you can then call as part of a loop (program or range variable)
.
Stuart
May 01, 2016
09:37 AM
- Mark as New
- Bookmark
- Subscribe
- Mute
- Subscribe to RSS Feed
- Permalink
- Notify Moderator
Please log in to access translation
May 01, 2016
09:37 AM
Stuart, Thanks for looking into my problem.
I have tried splicing your routine into the program and assigned a range variable to z (ultimately I would like to vary all x, y and z) but running into difficulty with extracting the maximum root for each iteration z. My function f(x1,y1,z1) now has complex roots and includes all roots. So I need to extract the max root for each iteration and use this as s1s in subsequent equations. The current max(f(x1,y1,z1)) only gives a single value and not the multiple values for the range variable z1?
Cheers
Ross
Apr 29, 2016
06:37 AM
- Mark as New
- Bookmark
- Subscribe
- Mute
- Subscribe to RSS Feed
- Permalink
- Notify Moderator
Please log in to access translation
Apr 29, 2016
06:37 AM
What do you think about my solution?
May 01, 2016
09:45 AM
- Mark as New
- Bookmark
- Subscribe
- Mute
- Subscribe to RSS Feed
- Permalink
- Notify Moderator
Please log in to access translation
May 01, 2016
09:45 AM
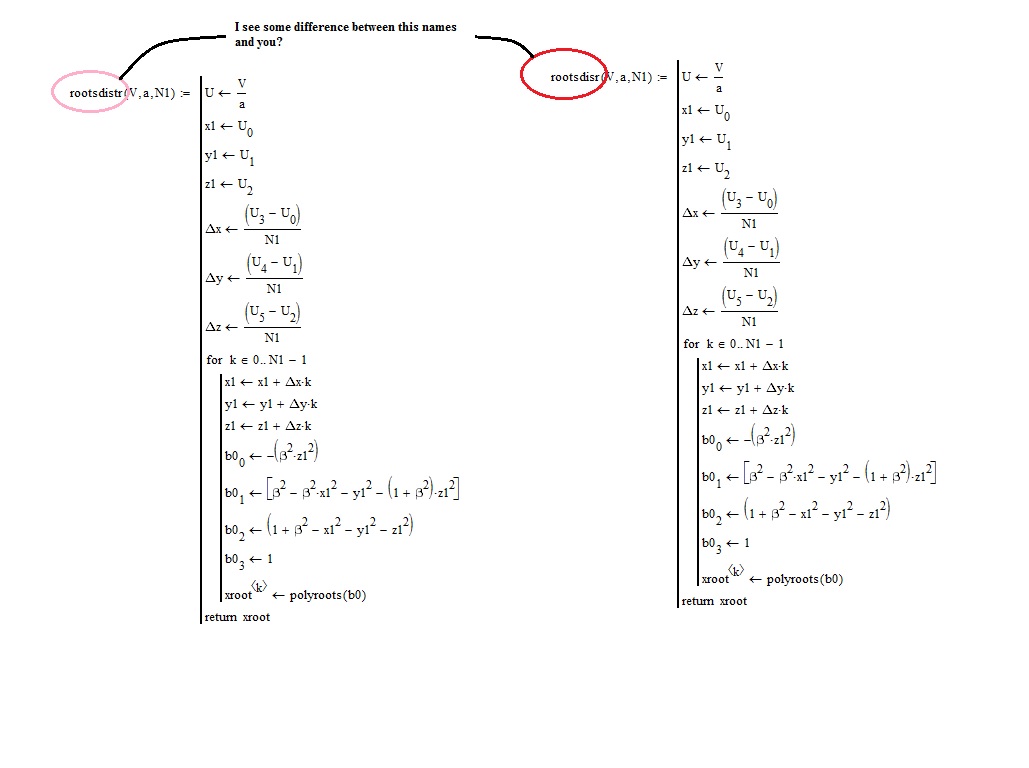
FM, I can see where you are going with this enhancement. Your programming skills are a level above mine. I have tried reproducing your routine but something basic is missing.I think there are some errors in the definition of deltax, deltay and deltaz but that does not seem to be the reason for the undefined variable ? Perhaps you could send your version of the mathcad sheet.
Thanks
Ross
May 02, 2016
09:35 AM
- Mark as New
- Bookmark
- Subscribe
- Mute
- Subscribe to RSS Feed
- Permalink
- Notify Moderator
Please log in to access translation
May 02, 2016
09:35 AM
In my file goes all "smoothly". You have incorrectly written the name of the rootsdistr routine.
Bye
May 02, 2016
07:01 PM
- Mark as New
- Bookmark
- Subscribe
- Mute
- Subscribe to RSS Feed
- Permalink
- Notify Moderator
Please log in to access translation
May 02, 2016
07:01 PM
FM, That leaves me a bit red faced with embarrassment! Thanks for the correction to a simple error. I will include this routine in the progarm. thanks for your help.
Ross
May 08, 2016
06:56 AM
- Mark as New
- Bookmark
- Subscribe
- Mute
- Subscribe to RSS Feed
- Permalink
- Notify Moderator
Please log in to access translation
May 08, 2016
06:56 AM
FM, I have incorporated your suggested routine into my calculation and now get results for a 3D grid which is just what I wanted. Brilliant!! However, I am having difficulty plotting contours for a specific X-Z or Y-Z plane. Do you have any ideas on how to assign the 3D x,y,z coordinates to a 2D plane subset of the results so the contours can be plotted? Any assistance would be appreciated.
Cheers
ross
May 09, 2016
12:10 PM
- Mark as New
- Bookmark
- Subscribe
- Mute
- Subscribe to RSS Feed
- Permalink
- Notify Moderator
Please log in to access translation
May 09, 2016
12:10 PM
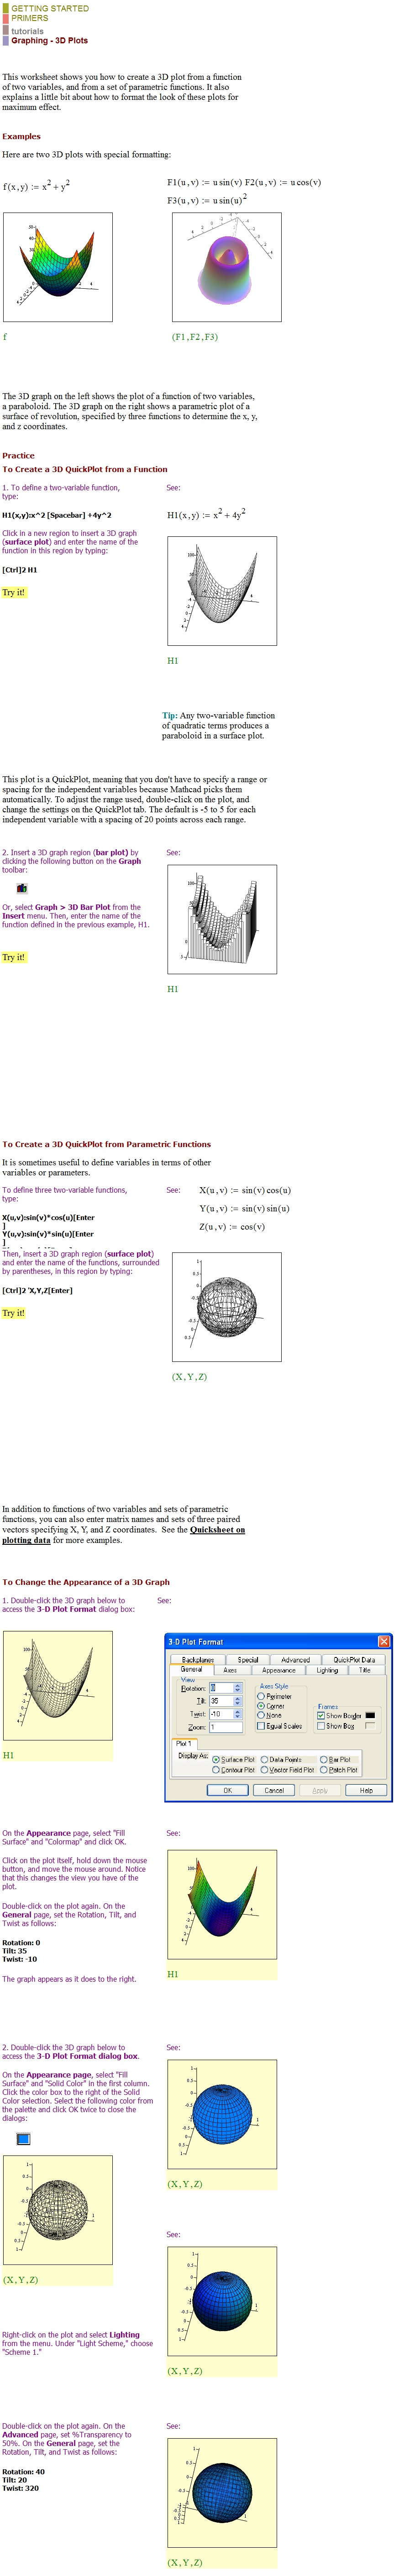
Hi Ross. Since it is not clear what do you want to plot, for now, I can advise you to read the mathcad guide on 3D graphics and of which I am attaching a photo.
Greetings
F. M.
May 10, 2016
04:16 AM
- Mark as New
- Bookmark
- Subscribe
- Mute
- Subscribe to RSS Feed
- Permalink
- Notify Moderator
Please log in to access translation
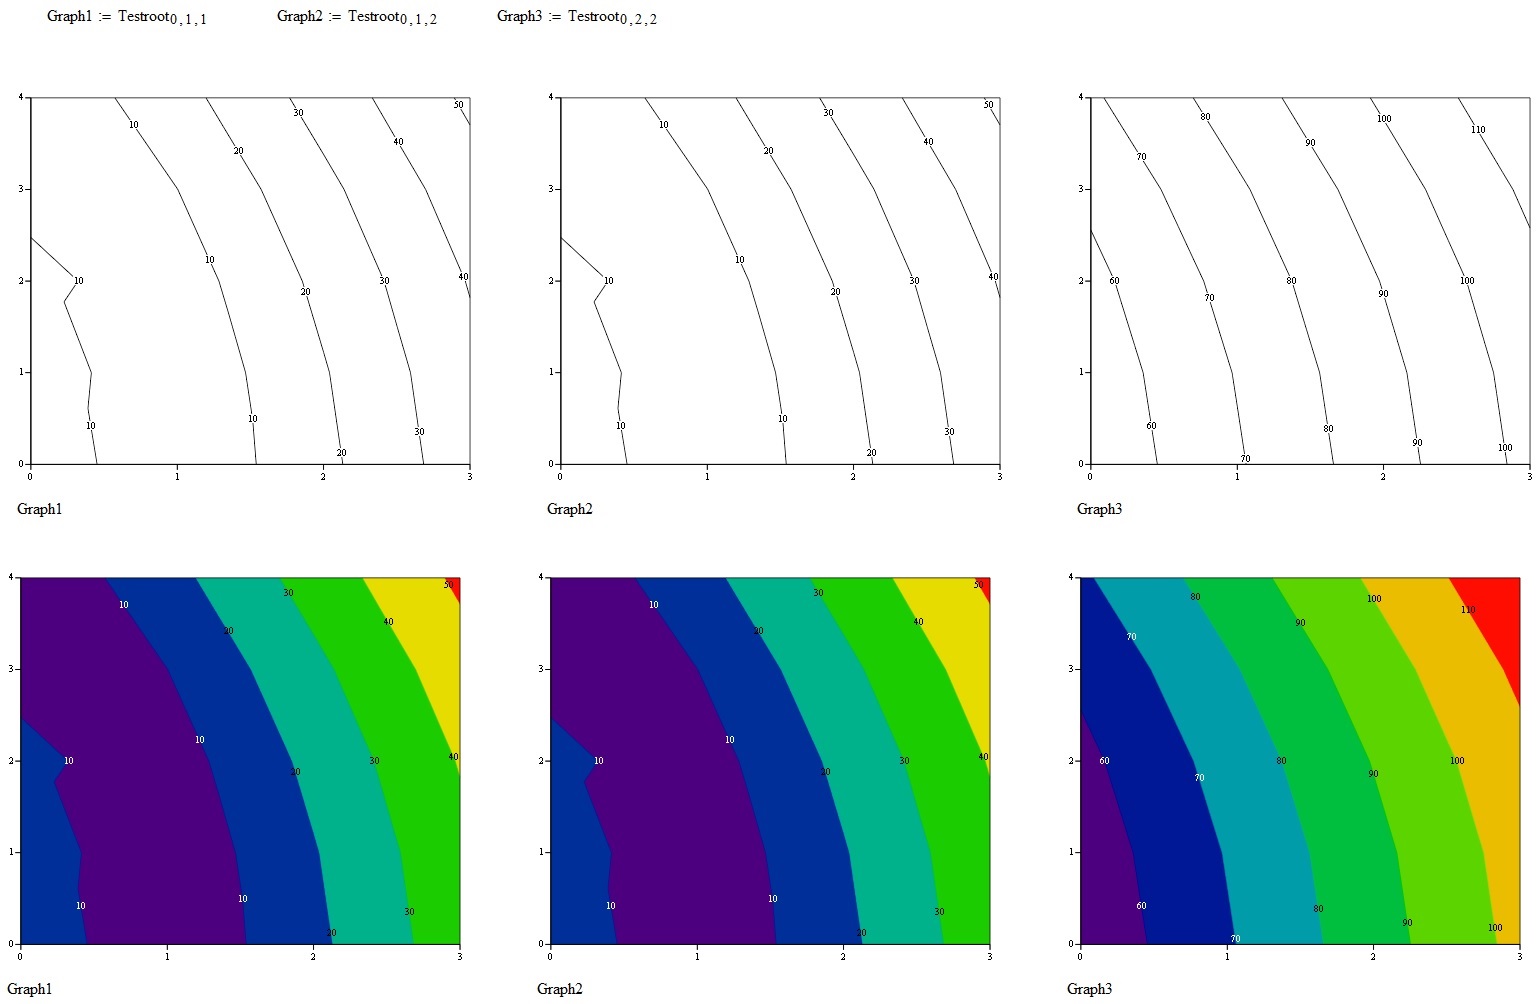
May 10, 2016
04:16 AM
FM,
In Rev3 above I have a 3D matrix of all computed stress values (called Testroot), which is essentially the stress values distributed through a 3D solid rectangle with geometric coordinates (x1,y1,z1). I now wish to plot the stress results in contour from for a plane cut through this solid say the plane (1.0,y1,z1). The examples showing how to plot contours of data in the Mathcad tutorials use range variables for a predefined function e.g. f(xsubi,ysubi). My results matrix has no asssociativity to the geometry co-ordinates. Is there an easy way of extracting the data for a 2D plane from the 3D matrix of results and plotting this as a contour?
Thanks
Ross
May 10, 2016
07:43 AM
- Mark as New
- Bookmark
- Subscribe
- Mute
- Subscribe to RSS Feed
- Permalink
- Notify Moderator
Please log in to access translation
May 10, 2016
07:43 AM
Hello Ross, it's ok so?
Bye
FM
May 10, 2016
05:58 PM
- Mark as New
- Bookmark
- Subscribe
- Mute
- Subscribe to RSS Feed
- Permalink
- Notify Moderator
Please log in to access translation
May 10, 2016
05:58 PM
FM, Surprisingly simple! Many thanks for your assistance. Cheers ross
May 30, 2016
06:58 PM
- Mark as New
- Bookmark
- Subscribe
- Mute
- Subscribe to RSS Feed
- Permalink
- Notify Moderator
Please log in to access translation
May 30, 2016
06:58 PM
FM,
I am continuing to have difficulty obtaining correct answers for the three level nested loop. I believe the syntax I am using is incorrect. In the attached Example 3a sheet, I have bypassed the polyroots result I am attempting to calculate and simply sending the x1 increment to the output matrix (see XRoot). I am also doing this for y1 and z1 in separate calculations (YRoot and ZRoot).For each of the x1, y1 and z1 increments there should only be three different values(i.e. Nx=Ny=Nz=3). This is correct for x1 but not correct for y1 and z1. There are 7 different values of y1 in YRoot and 19 different values of z1 in ZRoot.
Can you advise where the problem lies.
Many Thanks Ross
May 31, 2016
05:31 AM
- Mark as New
- Bookmark
- Subscribe
- Mute
- Subscribe to RSS Feed
- Permalink
- Notify Moderator
Please log in to access translation
May 31, 2016
05:31 AM
FM,
I located an error in the loop in Example 3a sheet above which was incrementing x1, y1, z1 from the previous value in addition to the increment Deltax1 etc. this has been corrected in example sheet 3b attached. My understanding is that each of the 3x3 matricies should have alll elements the same for x1, y1 & z1. Can you advise how I can ensure that there will be 3x3x3=27 unique elements in the 3D Nx-Ny-Nz matrix.
Any ideas how to correct this?
Cheers
Ross
May 31, 2016
08:47 AM
- Mark as New
- Bookmark
- Subscribe
- Mute
- Subscribe to RSS Feed
- Permalink
- Notify Moderator
Please log in to access translation
May 31, 2016
08:47 AM
Hi E. R., I realize that my little program is unsatisfactory. I'm trying to reinterpret your problem. A point P moves in a lattice going from one plane to another and in each point must calculate a particular property at that same point. I wrote this little program that does what I said. The result is rather strange.
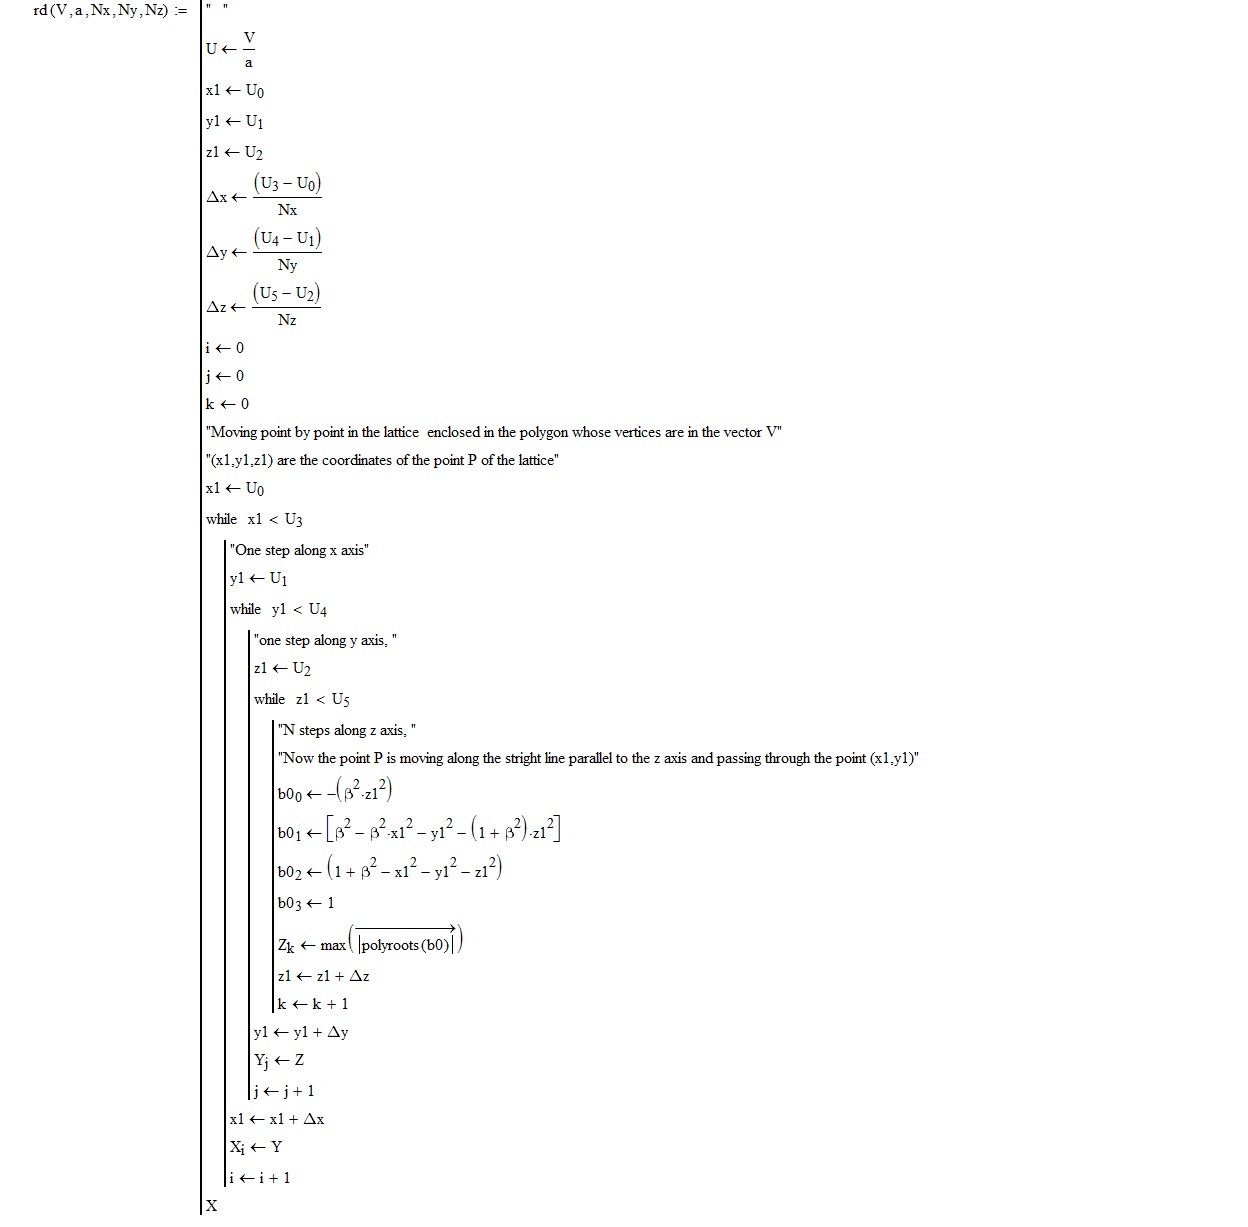
I have considered the modulo of each root since in pairs they can be complex conjugates.
Perhaps it is more acceptable my previous version, of course, after eliminating some mistakes.
Jun 01, 2016
04:19 AM
- Mark as New
- Bookmark
- Subscribe
- Mute
- Subscribe to RSS Feed
- Permalink
- Notify Moderator
Please log in to access translation
Jun 01, 2016
04:19 AM
FM,
This is a baffling problem. I have included your "ESDU first part" program on the same sheet as the original equations to derive the Polyroots from my "Example 1" sheet and the program values do not correlate with the matrix values from your program. The maximum root for the example (x,y,z) = (1.0,0.5,0.2) equals 0.07287. I have also calculated several other points using this manual method and included the results in an Excel table in the attached sheet. The 3x3x3 matrix output for the example in the attached sheet should include the result for (x,y,z) = (1.0,0.5,0.2) equals 0.07287. But this value does not appear anywhere in the program results??? This seems to indicate that the nested loop is still not computing the correct or expected results.
Many thanks for your continued assistsance.
Cheers
Ross
Jun 01, 2016
10:41 AM
- Mark as New
- Bookmark
- Subscribe
- Mute
- Subscribe to RSS Feed
- Permalink
- Notify Moderator
Please log in to access translation
Jun 01, 2016
10:41 AM
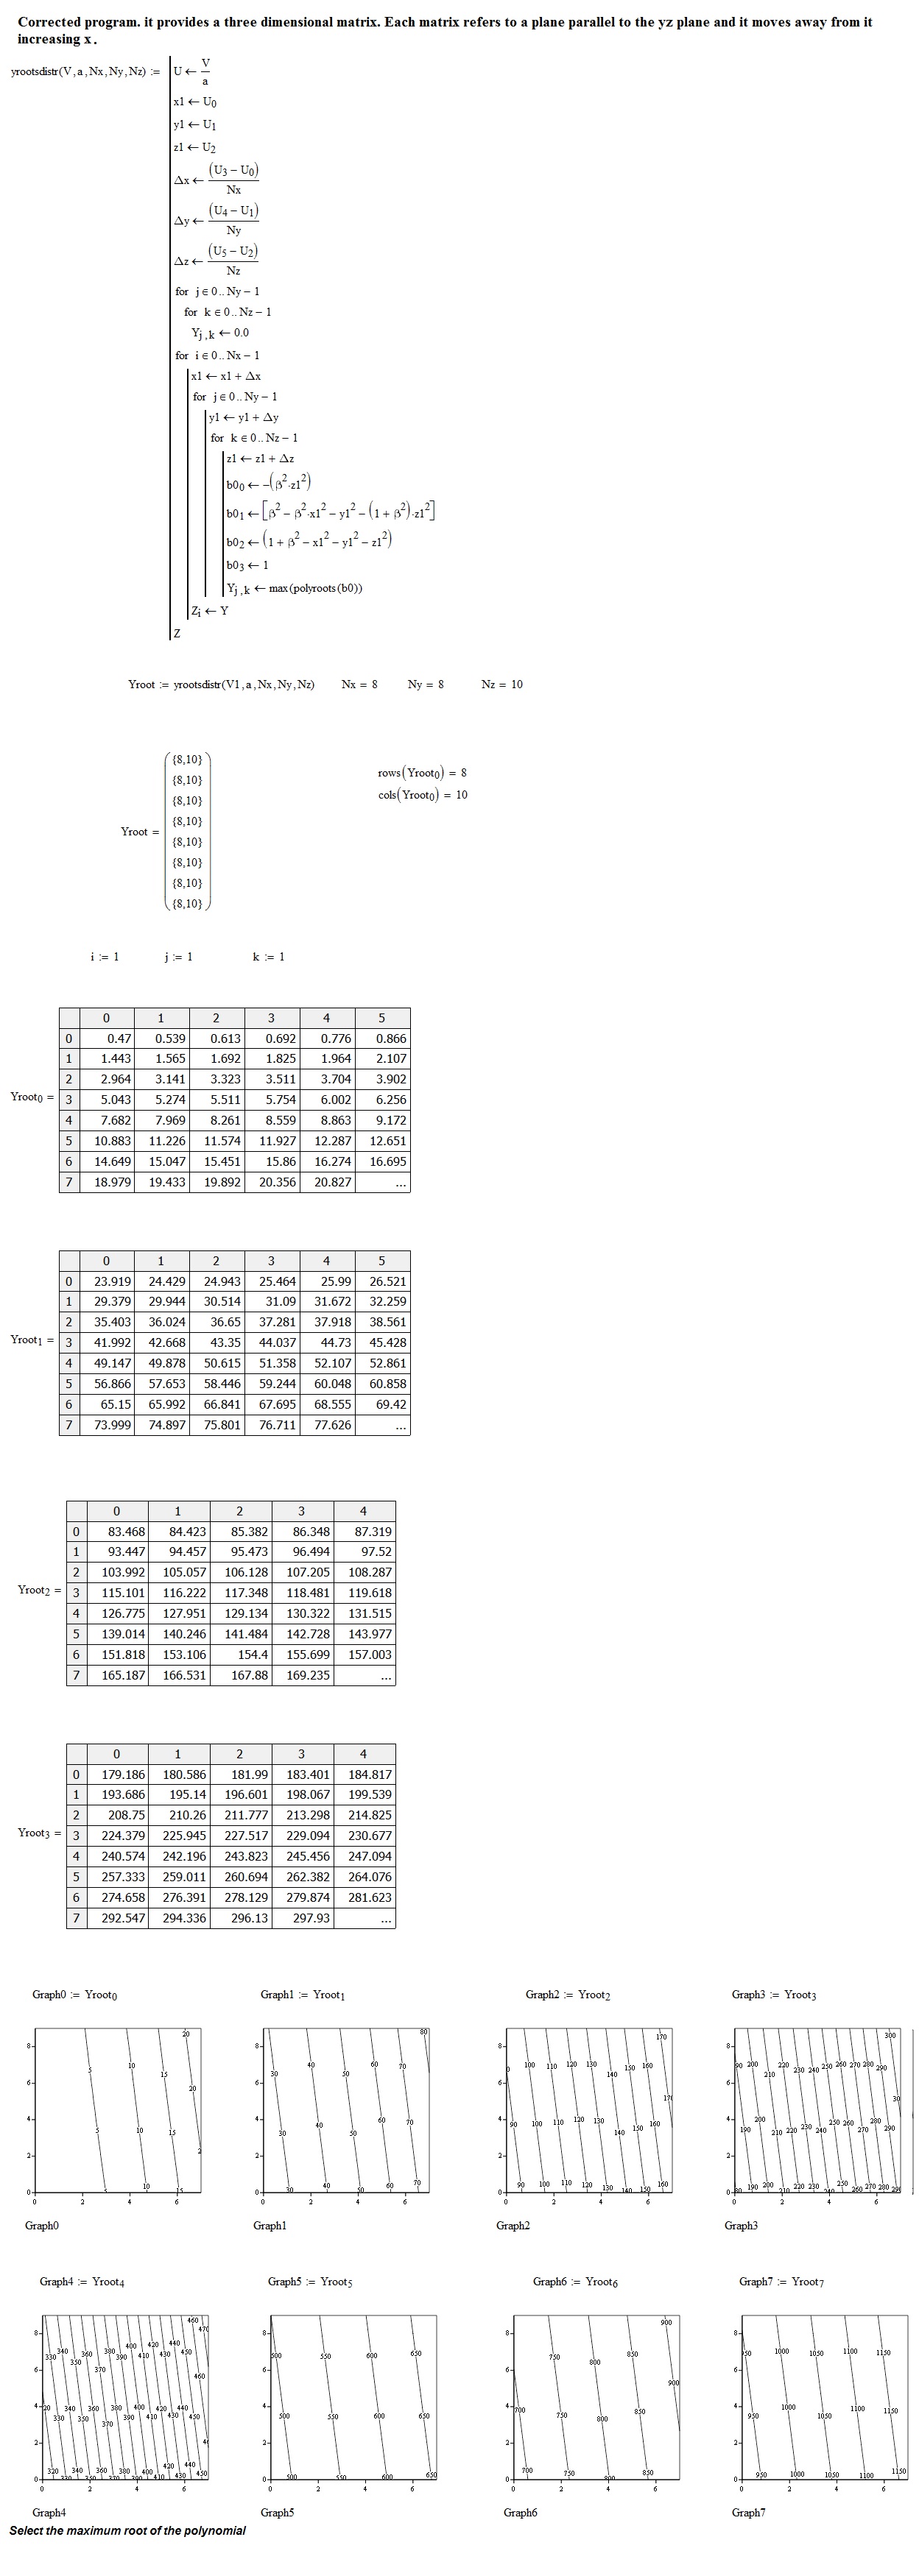
Dear Mr. RE, I would like to know what values can take the integer constants Nx, Ny, Nz.
Also, if you could enlighten me, wanting to know more, at least all that leads to the polynomial equation used.
I attached the revised version 4 with some modest results.
With best regards
FM
Jun 02, 2016
03:40 AM
- Mark as New
- Bookmark
- Subscribe
- Mute
- Subscribe to RSS Feed
- Permalink
- Notify Moderator
Please log in to access translation
Jun 02, 2016
03:40 AM
FM,
Your revised program in version 4 now calculates the correct value for the first point in the calculation being (x,y,z) = (0,0,0.1) = 0.00278.  . However, all other points seem to deviate from what is expected and grow in magnitude
 .
.
The Nx, Ny and Nz integer values represent the number of points along each axis within the 3D lattice that stresses are to be calculated. The calculation routine is not valid for the surface (z=0) but is valid for z>0 (i.e. below the surface of contact- see diagram for orientation of axes at the head of the sheet).The maximum root for the example (x,y,z) = (1.0,0.5,0.2) equals 0.07287 is a value given in the technical paper as a worked example and the manual method computes this value correctly. The nested loops certainly count correctly but do not seem to increment correctly. I have attached an extract from the technical paper providing the methodology and equations. The worked example is at the end of this extract. I trust this assists.
Regards,
Ross
Jun 02, 2016
04:33 AM
- Mark as New
- Bookmark
- Subscribe
- Mute
- Subscribe to RSS Feed
- Permalink
- Notify Moderator
Please log in to access translation
Jun 02, 2016
04:33 AM
FM,
Your question about Nx,Ny,Nz prompted a review and the deltax, deltay and delta z need to have the denominator reduced by one i.e. Nx-1, Ny-1 and Nz-1. This now gives three correct results as shown in attached sheet. It still seems the increments are not being computed correctly??
Regards,
Ross
Jun 02, 2016
06:37 AM
- Mark as New
- Bookmark
- Subscribe
- Mute
- Subscribe to RSS Feed
- Permalink
- Notify Moderator
Please log in to access translation
Jun 02, 2016
06:37 AM
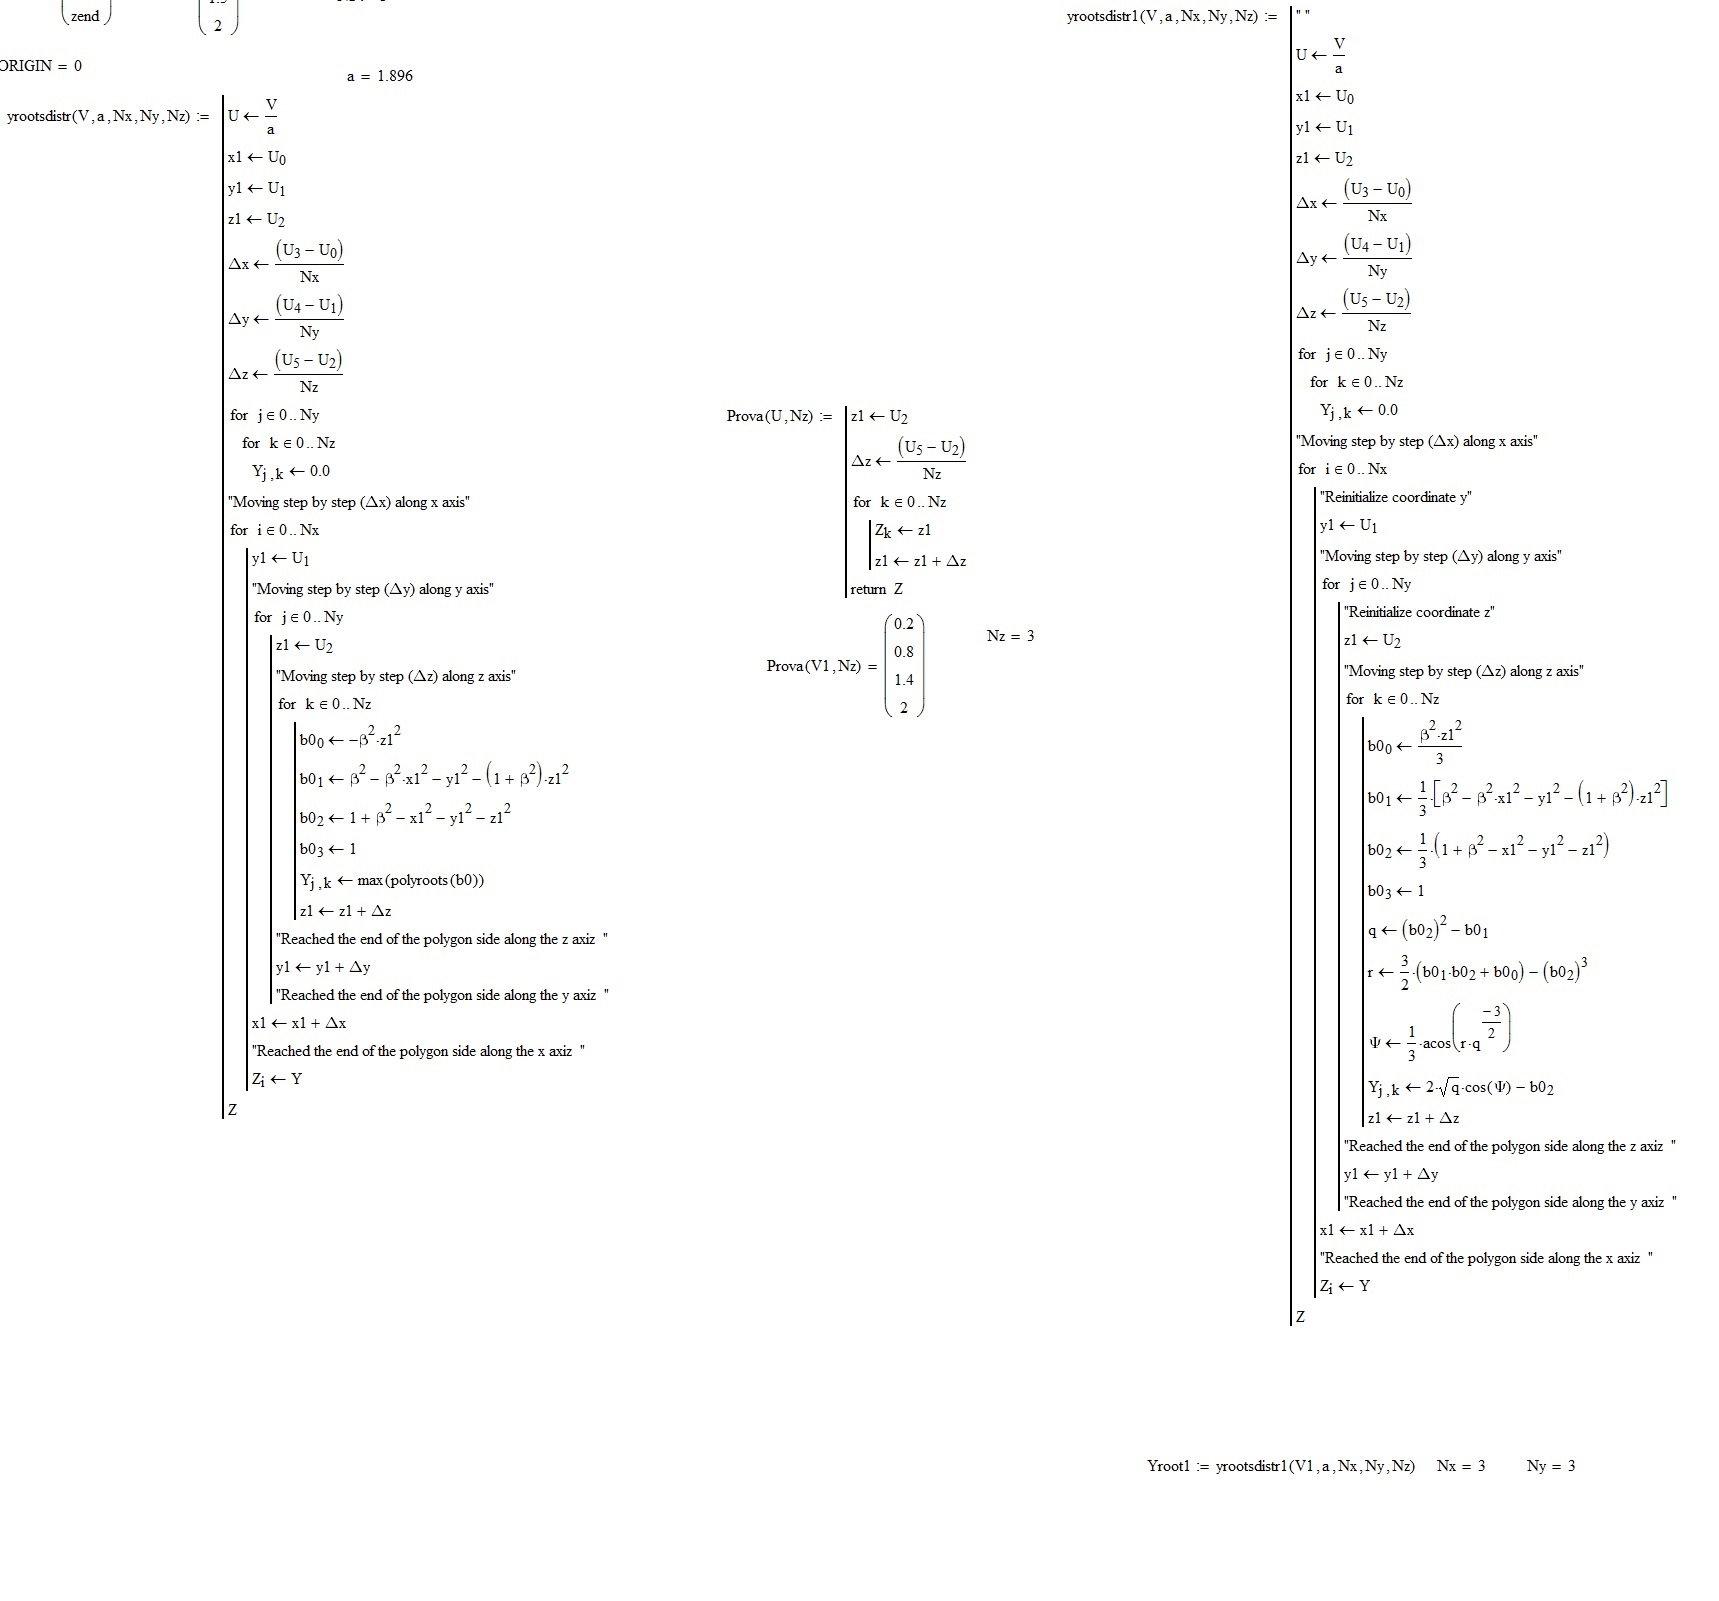
Hi, RE,
I made some changes and compared the result with the solution provided by the posted document, which already provides the formula for calculating the maximum root at a point P (x, y, z) , so there would be no need to use polyroots. Given that the increments are made at the end of each loop, you have to replace Nx-1, Ny-1, Nz-1 with Nx, Ny, Nz in the two programs, as follows:
Yours sincerely.
FM
Jun 03, 2016
01:39 AM
- Mark as New
- Bookmark
- Subscribe
- Mute
- Subscribe to RSS Feed
- Permalink
- Notify Moderator
Please log in to access translation
Jun 03, 2016
01:39 AM
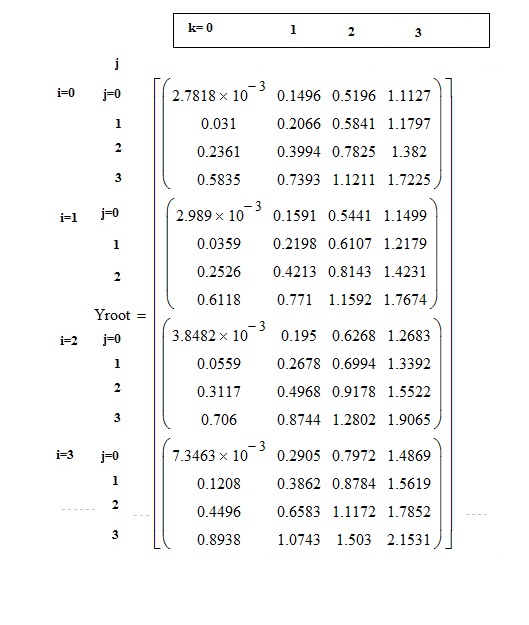
FM,
You are a legend! I have made a small change that changes Nx, Ny,Nz to Nx-1, Ny-1, Nz-1. This gives exact correlation for the 3x3x3 grid I am using as the example (see attached sheet Rev5_FM_RE). So the loop is working well for evaluating the polyroots value. If you can bear with me a little further!! I have inserted your nested loop program into my stress calculation where the results from the max polyroots calculation is now a variable (s1s) along with x1,y1,z1 to calculate stresses (qe) on the lattice of points (see attached Rev 8 sheet).
When I check these results with the exact values from a manual program for a single point I find the first three values calculated for z=0,1,2 and x=0, y=0 in the most inner loop give exact results but when the nested loop indexes to y=1,2 and then x=1,2 the calculated values are not exact and as the calculation progresses further into the y and x loops the results get progressively more inaccurate. This indicates to me that there is now a residual value carrying over into the subsequent loops. I have tried re-setting s1s = 0 each time but this doesn't seem to make any difference. Do you have any ideas on the source of the problem?
Many thanks for all the time you have given up.
Cheers
ross
Jun 03, 2016
04:07 AM
- Mark as New
- Bookmark
- Subscribe
- Mute
- Subscribe to RSS Feed
- Permalink
- Notify Moderator
Please log in to access translation
Jun 03, 2016
04:07 AM
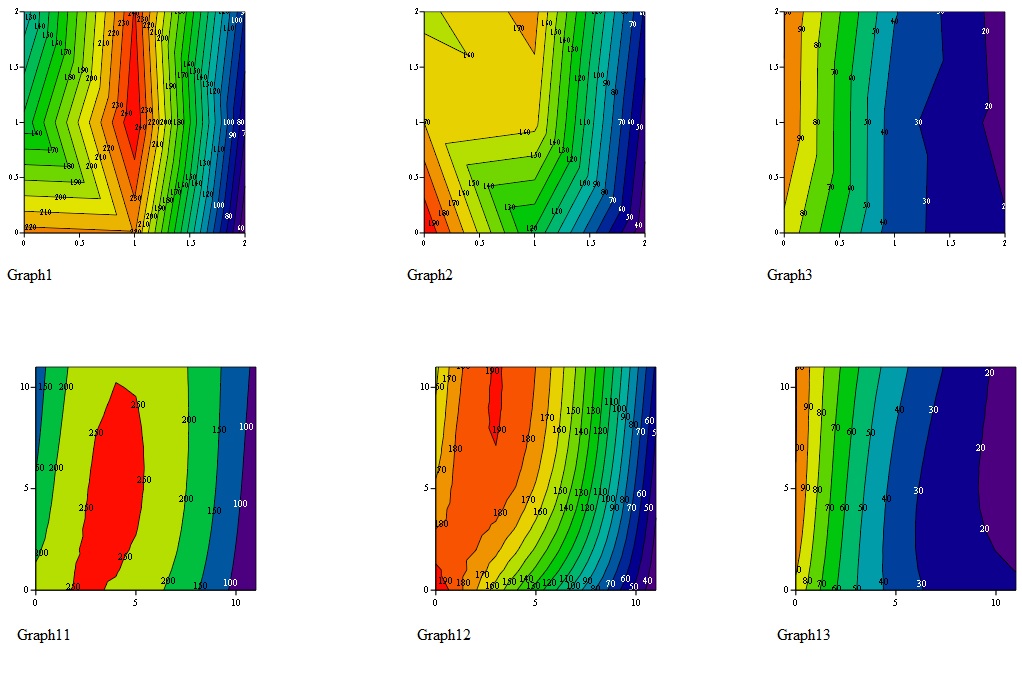
Sadly as you know, with the numerical calculations, there is the phenomenon of error propagation with the rise of the calculations. In your worksheet, there are quite a few. You also have to consider the source of the data with which you do the comparison, could be those, not so exact ... I, for now, I would not know what to change to eliminate the imprecision that you show me. With regard to your charts, you may do a fitting with some interpolating program. I'll give you an example in the picture here below.
Best regards
FM
Jun 07, 2016
08:35 AM
- Mark as New
- Bookmark
- Subscribe
- Mute
- Subscribe to RSS Feed
- Permalink
- Notify Moderator
Please log in to access translation
Jun 07, 2016
08:35 AM
FM,
I appreciate the time you have spent solving my nested loop issues. You have made great progress. I have been trying to de-bug the latest version to see why there is a difference between the "manual" program that calculates a single value and the 3D matrix calculation. They use exactly the same equations and the fact that some results are an exact match and others out by 30% is difficult to understand. I will ponder over the problem some more. In the meantime thanks again for your help.
Regards,
Ross
Jun 09, 2016
09:58 AM
- Mark as New
- Bookmark
- Subscribe
- Mute
- Subscribe to RSS Feed
- Permalink
- Notify Moderator
Please log in to access translation
Jun 09, 2016
09:58 AM
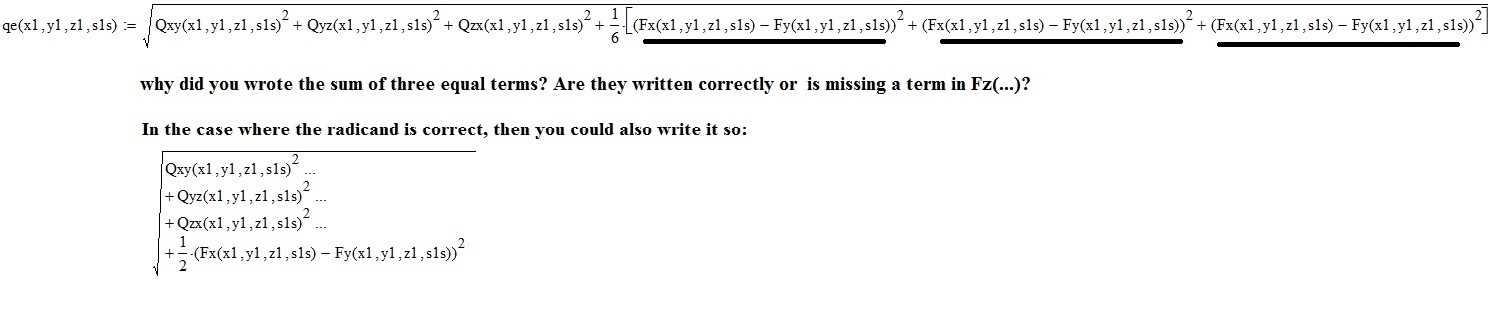
Hi RE.
Today I took a look at your project. Although I have not examined in depth the subject in question, however, I see that in the calculation of the equivalent shear stress,
I wonder if the radicand is written correctly, or rather, is missing a term in Fz(.)? I apologize if my impression is wrong.
Greetings.
Jun 14, 2016
06:25 PM
- Mark as New
- Bookmark
- Subscribe
- Mute
- Subscribe to RSS Feed
- Permalink
- Notify Moderator
Please log in to access translation
Jun 14, 2016
06:25 PM
FM,
After some laborious cross checking between the single value calculation and the program for each individual equation I found another error (in the variable C) that causes the deviation in values for some but not all values in the nested loop.
The attached Version 9 now gives exact answers. It took a while but we did get there. Many thanks once again for your assistance.
If you have had enough of my questions please jut say so and I will stop!
With the graphical presentation of the contour plot Graph2, I want to show the results with the x axis at the top of the plot showing a representation of the stresses from the surface (z=0) to below the surface. I have manipulated the Testroot results column by column and reconstructed the 2D matrix using "augment". This gives me what I want in the graph titled "FLIP". Is there command that will do this matrix column flip more easily?
Thanks again. Ross
Jun 15, 2016
04:00 AM
- Mark as New
- Bookmark
- Subscribe
- Mute
- Subscribe to RSS Feed
- Permalink
- Notify Moderator
Please log in to access translation
Jun 15, 2016
04:00 AM
Jun 15, 2016
06:40 PM
- Mark as New
- Bookmark
- Subscribe
- Mute
- Subscribe to RSS Feed
- Permalink
- Notify Moderator
Please log in to access translation
Jun 15, 2016
06:40 PM
FM,
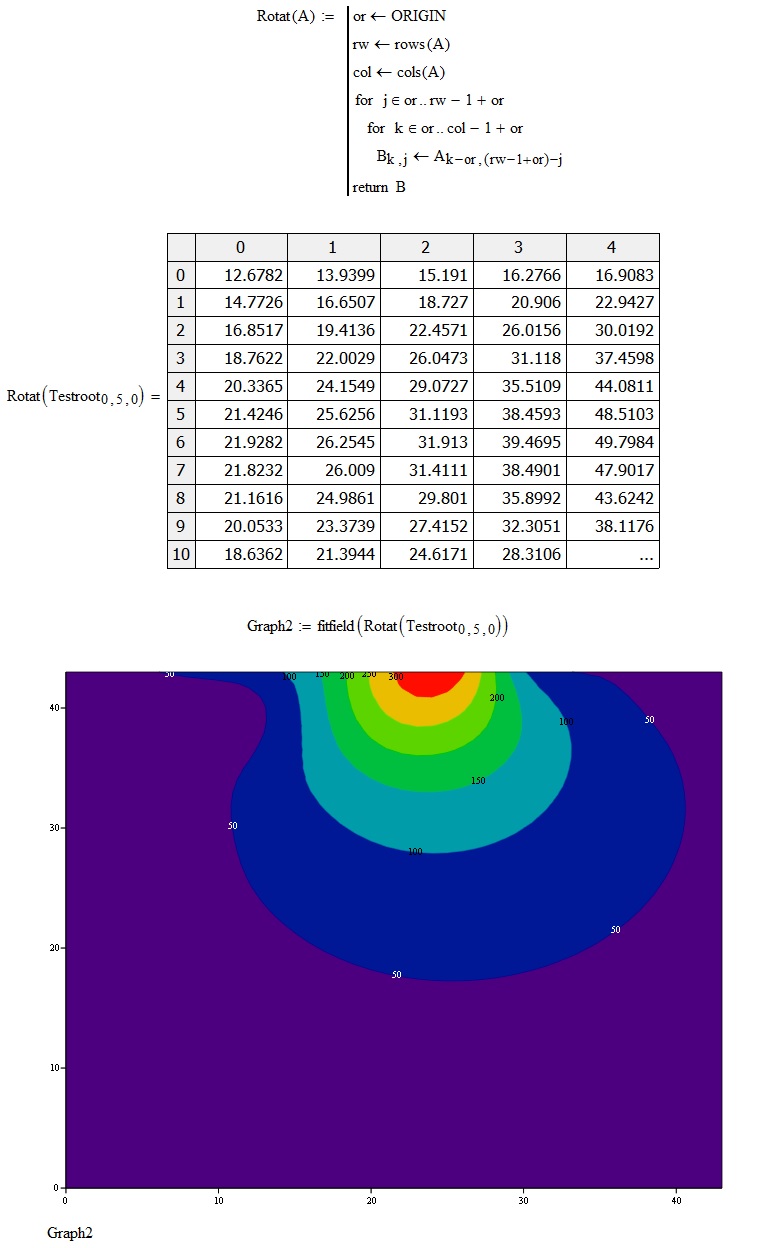
You have done a beautiful job of smoothing the contours (thanks), however, that was not what I am trying to do. In my Rev 9 sheet attached to my last post and in your reply above, Graph1 and Graph2 show the high stresses (i.e. the red "hot spot") at the bottom of the plot. This plot presents the results upside-down. I wish to present my results with the "hot spot" at the top of the plot as is shown in my Graph4. So I would like the mirror image of Graph2 about the bottom axis of the graph. I would like an automated way of flipping the columns in the Testroot 2D matrices so that the results shown in Graph2 appear as is shown in Graph4. I created Graph4 manually using the augment function and I would like this done automatically in a program for any matrix size (Nx in the Rev9 sheet).
Cheers Ross
Jun 16, 2016
02:42 AM
- Mark as New
- Bookmark
- Subscribe
- Mute
- Subscribe to RSS Feed
- Permalink
- Notify Moderator
Please log in to access translation
Jun 16, 2016
02:42 AM
Jun 16, 2016
11:03 AM
- Mark as New
- Bookmark
- Subscribe
- Mute
- Subscribe to RSS Feed
- Permalink
- Notify Moderator
Please log in to access translation
Jun 16, 2016
11:03 AM
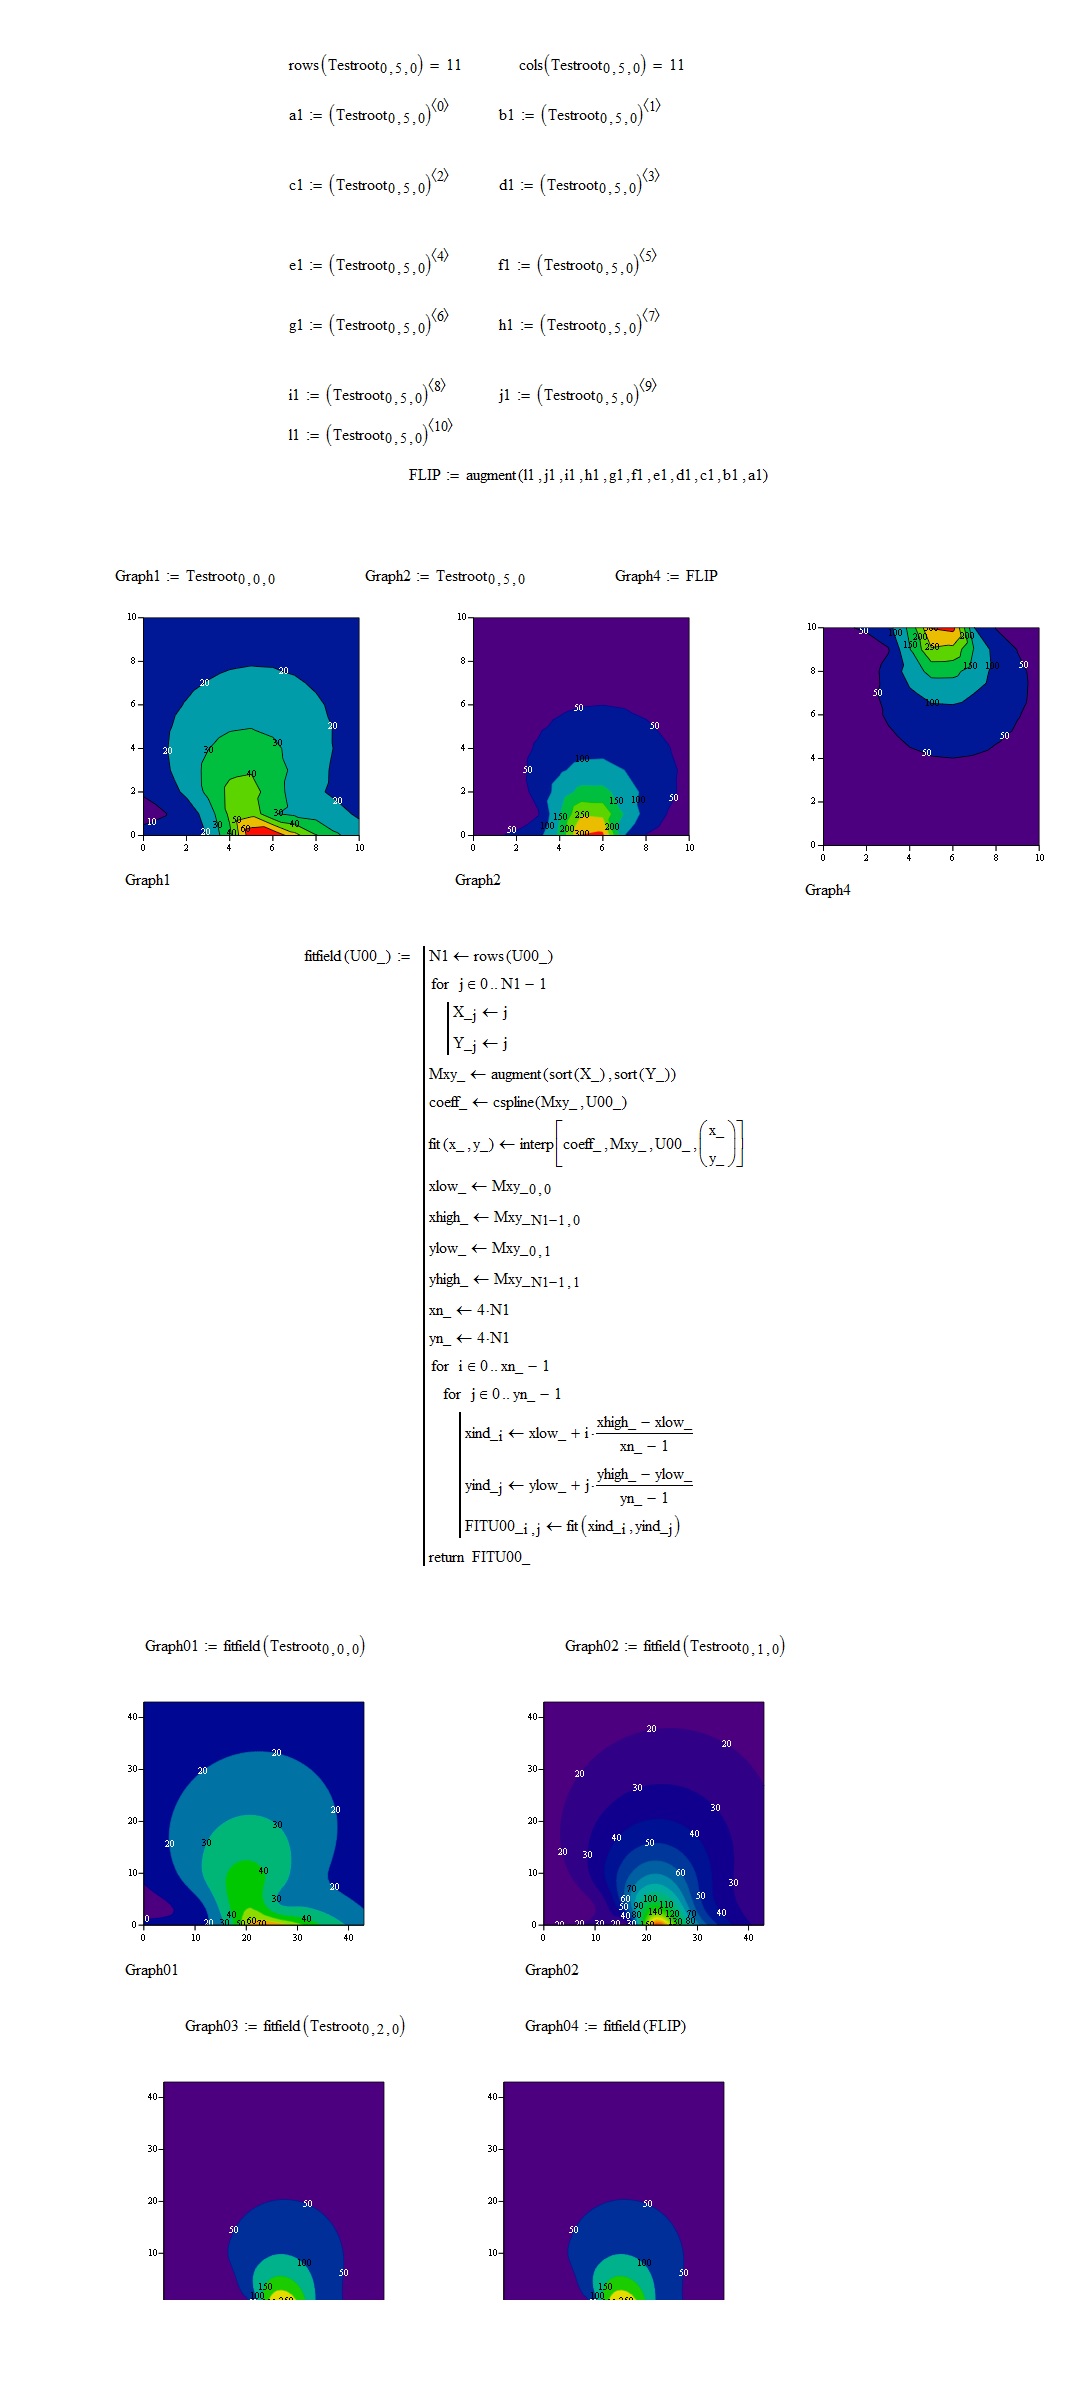
FM,
Absolutely brilliant! Just what was required. Could I trouble you for one more favor and attach your sheet that provides the "fitfield(U00_)" program. I am having trouble with the matrix sub-scripts that include the under-scores. I have not seen under-scores used in sub-scripts before.
Many Thanks
ross
Jun 16, 2016
11:36 AM
- Mark as New
- Bookmark
- Subscribe
- Mute
- Subscribe to RSS Feed
- Permalink
- Notify Moderator
Please log in to access translation
Jun 16, 2016
11:36 AM
Hi RE, attached, you can find what you required.
We are now at the end of the work. I wish you good luck and happy summer holidays. Here in Italy we are in summer.
Bye
FM


