Community Tip - When posting, your subject should be specific and summarize your question. Here are some additional tips on asking a great question. X
- Subscribe to RSS Feed
- Mark Topic as New
- Mark Topic as Read
- Float this Topic for Current User
- Bookmark
- Subscribe
- Mute
- Printer Friendly Page
Cassini ovals Plot
- Mark as New
- Bookmark
- Subscribe
- Mute
- Subscribe to RSS Feed
- Permalink
- Notify Moderator
Cassini ovals Plot
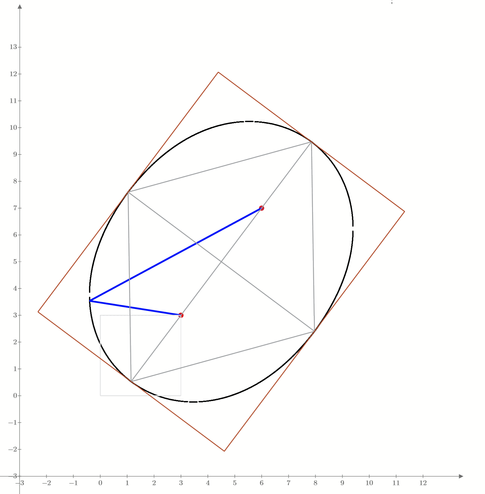
Do you know more nice way to plot
And not one haft - full. Prime 6 in attach.
- Labels:
-
Algebra_Geometry
- Mark as New
- Bookmark
- Subscribe
- Mute
- Subscribe to RSS Feed
- Permalink
- Notify Moderator
One possible way
Of course you could also consider using uni's implicitplot2D function 😉
- Mark as New
- Bookmark
- Subscribe
- Mute
- Subscribe to RSS Feed
- Permalink
- Notify Moderator
Thanks, but it's better this way. And the function implicitplot2D will not help here. This is the Leo Tolstoy oval - a special case of the Cassini oval. See Ovale de Cassini (mathcurve.com)
- Mark as New
- Bookmark
- Subscribe
- Mute
- Subscribe to RSS Feed
- Permalink
- Notify Moderator
And in Prime, the Ovals turn out to be somehow lopsided. Why?
- Mark as New
- Bookmark
- Subscribe
- Mute
- Subscribe to RSS Feed
- Permalink
- Notify Moderator
@ValeryOchkov wrote:
And in Prime, the Ovals turn out to be somehow lopsided. Why?
Probably because you did not scale both axis the same.
BTW, the side lengths of the outer rectangle are a*sqrt 5 and a*sqrt 3, so its easy to draw and can help to scale the axis correctly.
- Mark as New
- Bookmark
- Subscribe
- Mute
- Subscribe to RSS Feed
- Permalink
- Notify Moderator
Yes! We need a tool for same scale on the XY-plot. We have it in Mathcad 11 (?) bot now not. I know why! And You?
- Mark as New
- Bookmark
- Subscribe
- Mute
- Subscribe to RSS Feed
- Permalink
- Notify Moderator
@ValeryOchkov wrote:
Yes! We need a tool for same scale on the XY-plot. We have it in Mathcad 11 (?) bot now not. I know why! And You?
Not only MC11, the option "Equals Scale" is still there in MC15.
But it only works if you do not set axis limits and rely on AutoGrid. This option was not really as useful as it could have been and often produces some unexpected effects if you resize the plot region.
Therefore I guess it was not used that often - at least I very seldom relied on it.
You think we need that kind of option in Prime and you ask why we do not have such an option in Prime - really, honestly?
Serious improvements and "development" of Prime - these are two things that simply never went together right from the start - unfortunately! Prime was developed with real Mathcad already available as a basis for the math behind the scenes since 2009 (?). Thirteen years of development and look what we have now with P6 and P7. Its a shame!
- Mark as New
- Bookmark
- Subscribe
- Mute
- Subscribe to RSS Feed
- Permalink
- Notify Moderator
One company has been creating the program for 13 years.
The company has finally presented its program to users.
Users said - the Lord God created the World in 7 days, and you made your program in 13 years!
The company responded like this: Look at this World and look at our program.
- Mark as New
- Bookmark
- Subscribe
- Mute
- Subscribe to RSS Feed
- Permalink
- Notify Moderator
@ValeryOchkov wrote:
Thanks, but it's better this way.
Sorry, but the opposite is true. This is surely the worst way to plot a Cassini oval (which was what you asked for!). One only chooses this way of representation by means of just a set of unconnected dots only if one is either unable to set up an equation or one does not manage to plot the implicit equation. In case of the Cassini Oval you have an equation and can also (see my answer) specify a parametric representation. The use of the relatively simple polar representation of the curve equation would certainly also be possible.
- Mark as New
- Bookmark
- Subscribe
- Mute
- Subscribe to RSS Feed
- Permalink
- Notify Moderator
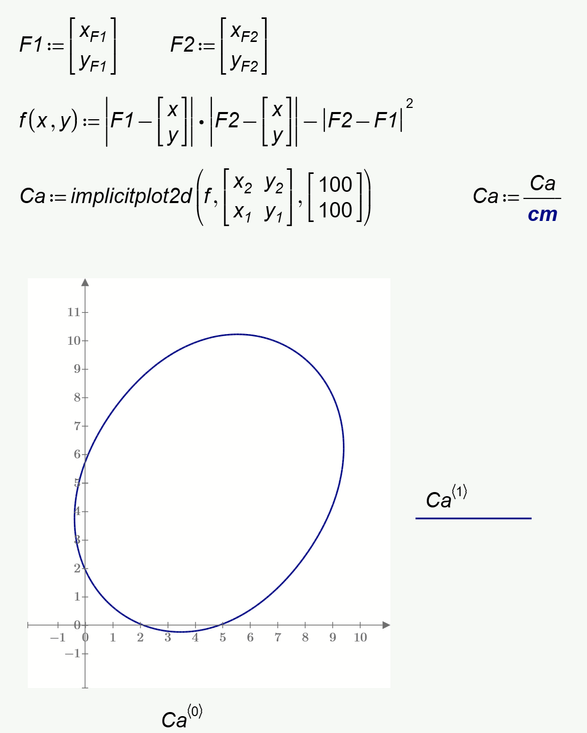
And the function implicitplot2D will not help here.
Why do you thinks so???
Of course you can use this function from Viacheslav N. Mezentsev.
I still think that using an equation like the parameter representation in my sheet is the better choice anyway, but Viacheslav's function sure is far better and also faster than testing every point in a 1000 x 1000 grid.
I gave it a try and it worked. I had to get rid of the (here unnecessary unit) because otherwise Prime would choke on the unitless imaginary units which Viacheslav uses to separate the line segments. If you really need the units here, you could change his function and add an appropriate unit to the separators - similar to what I did in my first answer by adding the units to the NaN's.
- Mark as New
- Bookmark
- Subscribe
- Mute
- Subscribe to RSS Feed
- Permalink
- Notify Moderator
- Mark as New
- Bookmark
- Subscribe
- Mute
- Subscribe to RSS Feed
- Permalink
- Notify Moderator
@ValeryOchkov wrote:
Exactly, thats my point. Stubbornly grazing through all grid points is not in the sense of KISS IMHO.
- Mark as New
- Bookmark
- Subscribe
- Mute
- Subscribe to RSS Feed
- Permalink
- Notify Moderator
I settled on the following.
As they say here in Russia, it is not aesthetically pleasing, but cheap, reliable and practical.
Это же неэстетично!..Зато дёшево, надёжно и практично! - YouTube
- Mark as New
- Bookmark
- Subscribe
- Mute
- Subscribe to RSS Feed
- Permalink
- Notify Moderator
Oh yes, brute force also has its own charm 😉
And provisional solutions that emerged quickly from the ground are usually those that last forever. "Never change a running system" applies here, too.
- Mark as New
- Bookmark
- Subscribe
- Mute
- Subscribe to RSS Feed
- Permalink
- Notify Moderator
Polar Plot!
- Mark as New
- Bookmark
- Subscribe
- Mute
- Subscribe to RSS Feed
- Permalink
- Notify Moderator
@Werner_E wrote:
@ValeryOchkov wrote:
Exactly, thats my point. Stubbornly grazing through all grid points is not in the sense of KISS IMHO.
One more thanks to V. Mezentsev program. See one Roots portrait
- Mark as New
- Bookmark
- Subscribe
- Mute
- Subscribe to RSS Feed
- Permalink
- Notify Moderator
SMath
- Mark as New
- Bookmark
- Subscribe
- Mute
- Subscribe to RSS Feed
- Permalink
- Notify Moderator


