Community Tip - Learn all about PTC Community Badges. Engage with PTC and see how many you can earn! X
- Subscribe to RSS Feed
- Mark Topic as New
- Mark Topic as Read
- Float this Topic for Current User
- Bookmark
- Subscribe
- Mute
- Printer Friendly Page
Chart with mathcad same in mathcad
- Mark as New
- Bookmark
- Subscribe
- Mute
- Subscribe to RSS Feed
- Permalink
- Notify Moderator
Chart with mathcad same in mathcad
Hi all,
I have new using Mathcad and then I have a chart in excel. How I can do that in Mathcad? thanks so much.
Solved! Go to Solution.
- Labels:
-
Civil_Engineering
Accepted Solutions
- Mark as New
- Bookmark
- Subscribe
- Mute
- Subscribe to RSS Feed
- Permalink
- Notify Moderator
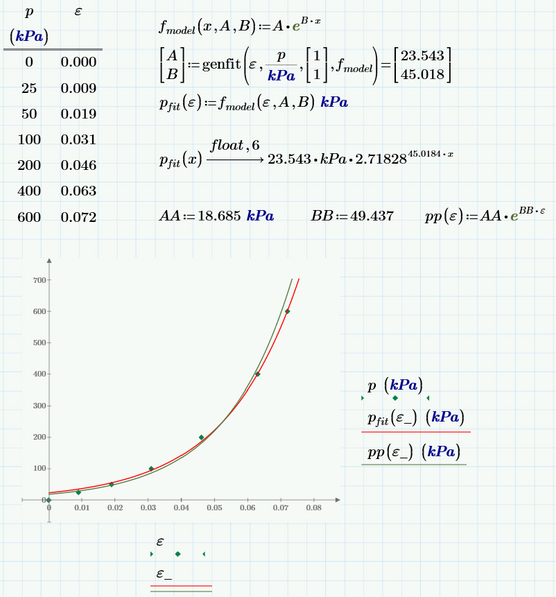
Obviously the labels in the Excel chart are wrong and should be exchanged.
Prime can also find a regression fit (a different one than shown in the Excel plot) for you.
Worksheet in format P6 attached
- Mark as New
- Bookmark
- Subscribe
- Mute
- Subscribe to RSS Feed
- Permalink
- Notify Moderator
Like this.
(See attached Prime 4 file)
Explanation:
Mathcad is NOT a spreadsheet program. It's more like mathematics. In your case p is/should be a function. I defined it a function of parameter epsilon.1 (because you had used that in the exponent). Note that this epsilon.1 is now unrelated to the epsilon.1 you defined to be 0.0515 just above p.
Now I assumed that you wanted to plot epsilon (from the table in the upper left) versus p (as a function of this epsilon) so I changed the expressions along the axes of the chart accordingly.
Success!
Luc
- Mark as New
- Bookmark
- Subscribe
- Mute
- Subscribe to RSS Feed
- Permalink
- Notify Moderator
Obviously the labels in the Excel chart are wrong and should be exchanged.
Prime can also find a regression fit (a different one than shown in the Excel plot) for you.
Worksheet in format P6 attached
- Mark as New
- Bookmark
- Subscribe
- Mute
- Subscribe to RSS Feed
- Permalink
- Notify Moderator
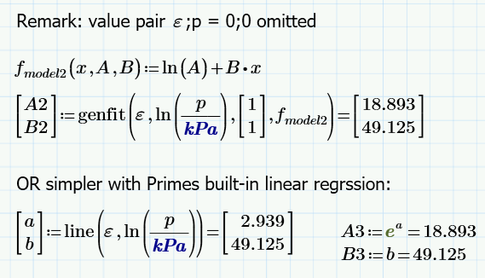
Just a remark:
If we omit the first data line (with epsilon and p zero) we get similar results as shown in the Excel image if apply a linear regression on the logarithmized data.


