Community Tip - Did you get an answer that solved your problem? Please mark it as an Accepted Solution so others with the same problem can find the answer easily. X
- Subscribe to RSS Feed
- Mark Topic as New
- Mark Topic as Read
- Float this Topic for Current User
- Bookmark
- Subscribe
- Mute
- Printer Friendly Page
Contour Plot Query
- Mark as New
- Bookmark
- Subscribe
- Mute
- Subscribe to RSS Feed
- Permalink
- Notify Moderator
Contour Plot Query
I was wondering if anyone knew how to reverse the direction of an axis on a contour plot in Mathcad Prime 2.0? I really want to see if this is possible without having to resort to detailing negative values on the axis. I also wanted to know if there was any way to modify the attributes (font type, bold, size, etc) on the numbers labelling the axis of the plot? Finally, is there a way to directly save the plot as an image of any kind?
Thanks a bunch.
- Labels:
-
Statistics_Analysis
- Mark as New
- Bookmark
- Subscribe
- Mute
- Subscribe to RSS Feed
- Permalink
- Notify Moderator
Unfortunately, as far as I am aware, the answer to all three questions is "no". And its not better in Prime 3.
- Mark as New
- Bookmark
- Subscribe
- Mute
- Subscribe to RSS Feed
- Permalink
- Notify Moderator
I was afraid of that. Thanks a million for your swift reply!
- Mark as New
- Bookmark
- Subscribe
- Mute
- Subscribe to RSS Feed
- Permalink
- Notify Moderator
In MathCad.
Play with the basic data not the axis. You can subtract from the largest and negate. You can swap the columns of matrices. You can use indexes into the data you want to contour and play with the indexes as the axis values.
Snipping tools are available to capture the image.
Um it works on my machine. Select the graph. Press Ctl-C for copy. Go to paint with a very small sized white graphic in the window. Press Ctl-V for paste. It enlarges the small graphic to the size of the pasted object.
Make your graphs big in the software before copying.
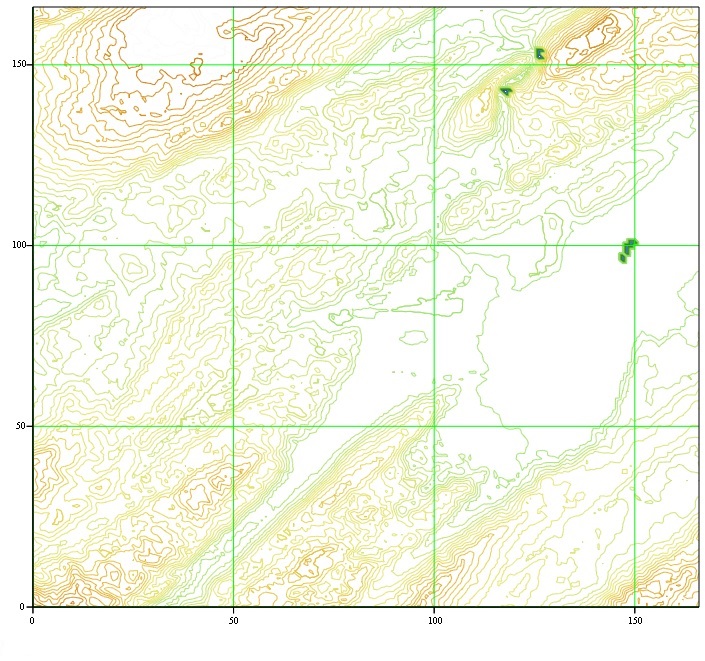
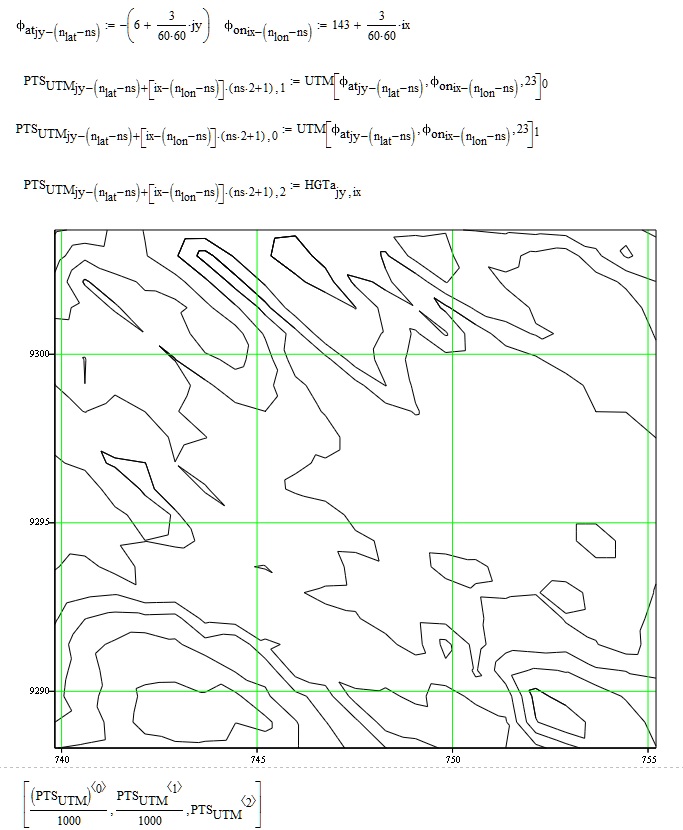
That is how this GIS northing and easting contour map is put up the right way with north up the page.
Real data from Shuttle Radar Topography Mission. Converted to easting northings from several tiles that meet on this map and then adjusted to put north up the page. Cut and Pasted as a graphic. This one it is the indexes into the dataset that is reversed. This way it simply plots the proper way round.

- Mark as New
- Bookmark
- Subscribe
- Mute
- Subscribe to RSS Feed
- Permalink
- Notify Moderator
Pedro,
The indexing of the three columns used as the input to the contour plot is the trick
UTM(a,b) is a function that calcs the relevant E/N in UTM.


