Community Tip - If community subscription notifications are filling up your inbox you can set up a daily digest and get all your notifications in a single email. X
- Subscribe to RSS Feed
- Mark Topic as New
- Mark Topic as Read
- Float this Topic for Current User
- Bookmark
- Subscribe
- Mute
- Printer Friendly Page
CreateMesh
- Mark as New
- Bookmark
- Subscribe
- Mute
- Subscribe to RSS Feed
- Permalink
- Notify Moderator
CreateMesh
- Labels:
-
Other
Accepted Solutions
- Mark as New
- Bookmark
- Subscribe
- Mute
- Subscribe to RSS Feed
- Permalink
- Notify Moderator
Valery Ochkov wrote:
What is Mesh in the name of the function CreateMesh?
Thanks, Val
I'm guessing it refers to a polygon mesh, using the general concept of a mesh.
Stuart
- Mark as New
- Bookmark
- Subscribe
- Mute
- Subscribe to RSS Feed
- Permalink
- Notify Moderator
м/б, создать сеточную поверхность?
- Mark as New
- Bookmark
- Subscribe
- Mute
- Subscribe to RSS Feed
- Permalink
- Notify Moderator
Thanks - I know it. See for example one picture - water density as finction of pressure and temperature
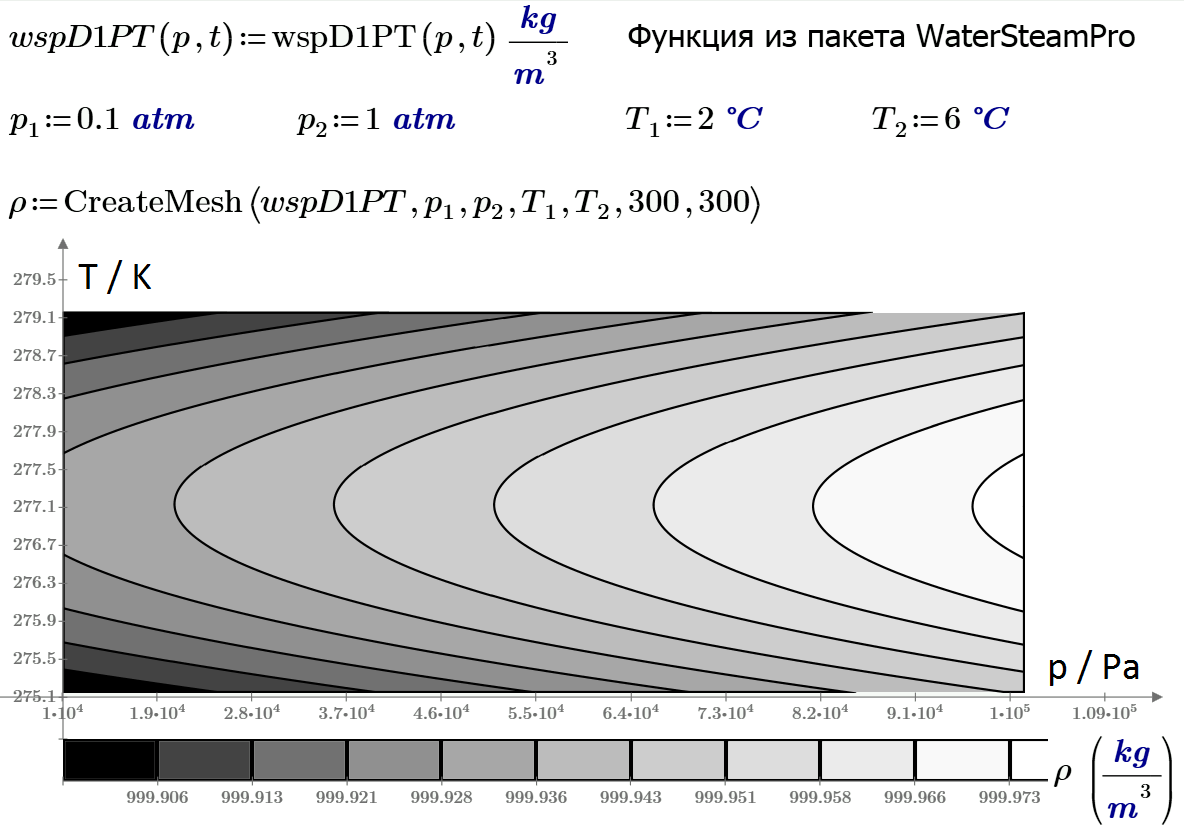
The begin of word is Mesh?
- Mark as New
- Bookmark
- Subscribe
- Mute
- Subscribe to RSS Feed
- Permalink
- Notify Moderator
I don't understand your question/problem.
You sure can't expect to see the mesh when you demand Prime to show a contour plot.
- Mark as New
- Bookmark
- Subscribe
- Mute
- Subscribe to RSS Feed
- Permalink
- Notify Moderator
Valery Ochkov wrote:
What is Mesh in the name of the function CreateMesh?
Thanks, Val
I'm guessing it refers to a polygon mesh, using the general concept of a mesh.
Stuart
- Mark as New
- Bookmark
- Subscribe
- Mute
- Subscribe to RSS Feed
- Permalink
- Notify Moderator
Thanks!
Can we create this Mesh in Mathcad![]() With animation!
With animation!

- Mark as New
- Bookmark
- Subscribe
- Mute
- Subscribe to RSS Feed
- Permalink
- Notify Moderator
Valery Ochkov wrote:
Thanks!
Can we create this Mesh in Mathcad
With animation!
Hmm... we should be able to, Valery ... in principle! 🙂
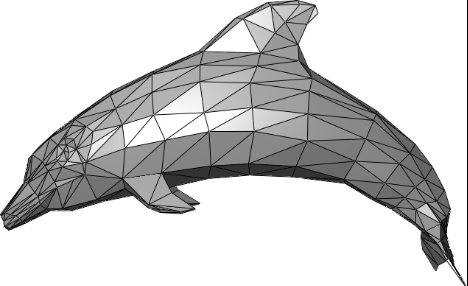
To paraphrase the old mathematical joke about modelling a horse (first, assume the horse is a sphere), then topologically the dolphin is equivalent to a deformed sphere (or torus if you consider it's digestive tract!) and the 3D plot will display one of those.
If we had the data that generates the dolphin triangular mesh, then it should be possible to create a Mathcad mesh equivalent and display that. It's a pity Mathcad doesn't have the Matlab function trisurf - that would make the job a lot easier.
Stuart
- Mark as New
- Bookmark
- Subscribe
- Mute
- Subscribe to RSS Feed
- Permalink
- Notify Moderator
Well, here's an inital stab, but from a different route. I used a scatter plot approach to create a triangular-faceted trio of dolphins from a .ply file. It's not ideal, as there are too many drawing artefacts and it doesn't do hidden line removal. With a bit of playing around it might be possible to extract each dolphin and then, using the Mathcad 15 3D Plot Object via the Insert Object menu, create a crude animation by cycling through them individually. Sounds like a job for the Russian Mathcadders! ![]()
Stuart

- Mark as New
- Bookmark
- Subscribe
- Mute
- Subscribe to RSS Feed
- Permalink
- Notify Moderator
The amazing images e-book has functions to create polygon meshes. Maybe they could be applied to your data. I'm too lazy to try it though ![]()
- Mark as New
- Bookmark
- Subscribe
- Mute
- Subscribe to RSS Feed
- Permalink
- Notify Moderator
Richard Jackson wrote:
The amazing images e-book has functions to create polygon meshes. Maybe they could be applied to your data. I'm too lazy to try it though
Hi Richard,
I've got some functions somewhere or other that do the same thing, but not on my work PC. As I'm now Glasgow based during the week, so I'll copy some likely looking files and try them next week.
Unfortunately, I haven't got Mathcad running on my home PC either. .. Some kind of licencing issue that I haven't found a cute for yet (even after clearing everything of the disk and out of the registry). This means I'm limited to my work place M14.
Cheers
Stuart
- Mark as New
- Bookmark
- Subscribe
- Mute
- Subscribe to RSS Feed
- Permalink
- Notify Moderator
Glasgow? So did you get to vote?
- Mark as New
- Bookmark
- Subscribe
- Mute
- Subscribe to RSS Feed
- Permalink
- Notify Moderator
Richard Jackson wrote:
Glasgow? So did you get to vote?
I could have done, but I didn't. As I'm still commuting up and down from the SE at weekends, I didn't feel comfortable doing so. So I stuck to eating deep-fried Mars Bars, downed with copious quantities of Heavy and Whiskey, whilst watching the show. ![]()
Stuart
- Mark as New
- Bookmark
- Subscribe
- Mute
- Subscribe to RSS Feed
- Permalink
- Notify Moderator
Richard Jackson wrote:
The amazing images e-book has functions to create polygon meshes. Maybe they could be applied to your data. I'm too lazy to try it though
In the end, I didn't need to use any particular functions ... just remember how 3D plots work. The 3D plot object uses a 3D rectangular grid (mesh) for defining the points to plot, but it's not so much a spatial rectangular grid as a mesh point array. To draw a triangle then simply define a single square grid in each of the x, y and z components, then map two of the triangle's coordinates to a grid point each and map the third point to the remaining two grid points.
This is the result.
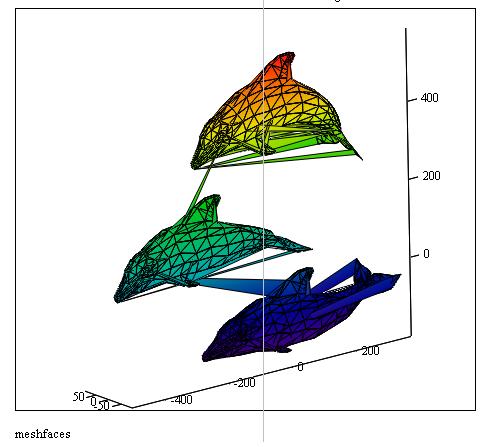
As you can see, I've got some tidying up to do to remove those extraneous joining triangles between the 3 dolphins. I'm not sure what causes them yet.
Stuart
- Mark as New
- Bookmark
- Subscribe
- Mute
- Subscribe to RSS Feed
- Permalink
- Notify Moderator
Thanks, Stuart!
then map two of the triangle's coordinates to a grid point each and map the third point to the remaining two grid points.
It is a sound (words) from one dolphin to other ![]()
And second and main!
Dolphin ia an animal - where is the animation?
- Mark as New
- Bookmark
- Subscribe
- Mute
- Subscribe to RSS Feed
- Permalink
- Notify Moderator
Valery Ochkov wrote:
Thanks, Stuart!
then map two of the triangle's coordinates to a grid point each and map the third point to the remaining two grid points.
It is a sound (words) from one dolphin to other
And second and main!
Nice Idea, Valery ... ultrasonic pulses! ![]()
Unfortunately, the answer is more prosaic and reflects an oft-noted shortcoming in Mathcad's 3D Plot component, namely the inability to globally or individually set the display parameters for a each of multiple plots.
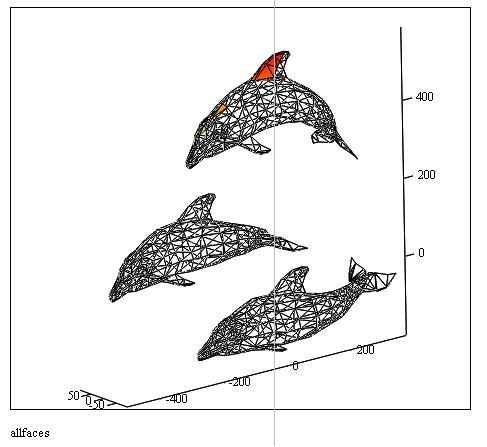
If I plot each triangular face individually, I end up with 1689 individual plots, each of which has the default Surface Plot setting - setting the plot parameters to "Fill Surface", "colourmap" by hand is not a task for the faint-hearted or the incredibly lazy (like me!) - here's an image of the first 18 faces set by hand with the rest having the default setting - as you can see, the dolphins have had an argument and aren't speaking to each other any more.
To get my Talking Dolphins image, I combined all of the faces into (effectively) one array. This gives a reasonable image except where the faces aren't contiguous (such as between dolphins or between the tail & nose). In this case the 3D plot component creates a face that doesn't exist in the .ply data.
I might have a play with the scripted version of the 3D Plot component when I have some free time and see if I can isolate the 3 dolphins to create a simple animation.
Stuart
- Mark as New
- Bookmark
- Subscribe
- Mute
- Subscribe to RSS Feed
- Permalink
- Notify Moderator
- Mark as New
- Bookmark
- Subscribe
- Mute
- Subscribe to RSS Feed
- Permalink
- Notify Moderator
Nice ![]()
- Mark as New
- Bookmark
- Subscribe
- Mute
- Subscribe to RSS Feed
- Permalink
- Notify Moderator
Super!
Now I am thinking what can we animate more!
- Mark as New
- Bookmark
- Subscribe
- Mute
- Subscribe to RSS Feed
- Permalink
- Notify Moderator
Wow, looks great!
- Mark as New
- Bookmark
- Subscribe
- Mute
- Subscribe to RSS Feed
- Permalink
- Notify Moderator
- Mark as New
- Bookmark
- Subscribe
- Mute
- Subscribe to RSS Feed
- Permalink
- Notify Moderator
- Mark as New
- Bookmark
- Subscribe
- Mute
- Subscribe to RSS Feed
- Permalink
- Notify Moderator

