Community Tip - Did you get an answer that solved your problem? Please mark it as an Accepted Solution so others with the same problem can find the answer easily. X
- Subscribe to RSS Feed
- Mark Topic as New
- Mark Topic as Read
- Float this Topic for Current User
- Bookmark
- Subscribe
- Mute
- Printer Friendly Page
Creating Path in mathcad
- Mark as New
- Bookmark
- Subscribe
- Mute
- Subscribe to RSS Feed
- Permalink
- Notify Moderator
Creating Path in mathcad
I need to create paths(creating matrix of coordinates) just check image that i have given below is there any simple method to solve this ? this graph has to be plot in x and y coordinates.
Solved! Go to Solution.
- Labels:
-
Math Homework
-
Mathcad Usage
Accepted Solutions
- Mark as New
- Bookmark
- Subscribe
- Mute
- Subscribe to RSS Feed
- Permalink
- Notify Moderator
@Mathcad111 wrote:
Don't worry about that matrix it's just an example,
I do worry because if it should be an example of what you are looking for it should be correct and include exactly the values you would like the Mathcad function to return.
As far as I can tell from your last post this function should only be dependent on two arguments which you call x_length and y_lengths.
So the values in the matrix would always be integers
in the first column from 0 to x_length
in the second column from 0 to y_length.
But in a picture you had posted you wrote something about a step width of 0.1 in y direction which would mean at least a third argument to the function ??
- Mark as New
- Bookmark
- Subscribe
- Mute
- Subscribe to RSS Feed
- Permalink
- Notify Moderator
Hi,
Please include your worksheet?
Cheers
Terry
- Mark as New
- Bookmark
- Subscribe
- Mute
- Subscribe to RSS Feed
- Permalink
- Notify Moderator
it's just a simple coordinating plot nothing much involves in that mathcad file
- Mark as New
- Bookmark
- Subscribe
- Mute
- Subscribe to RSS Feed
- Permalink
- Notify Moderator
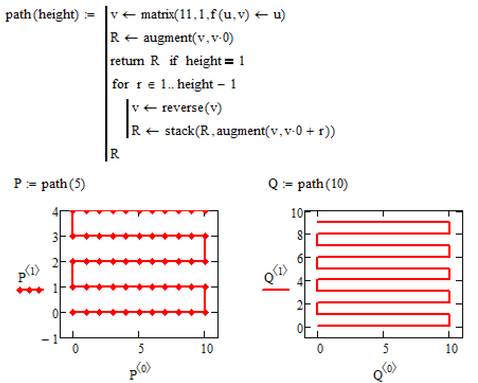
Here is one possible way to achieve what you are looking for:
But if you are only looking for a plot like the figure to the right (with out the intermediate points and with an even number of vertical lines) there might be easier ways to achieve.
- Mark as New
- Bookmark
- Subscribe
- Mute
- Subscribe to RSS Feed
- Permalink
- Notify Moderator
But how to control the values, i mean in x and y coordinates values? for example if i want to change from 0.1 to 1 or some other values in both coordinates..
- Mark as New
- Bookmark
- Subscribe
- Mute
- Subscribe to RSS Feed
- Permalink
- Notify Moderator
@Mathcad111 wrote:
But how to control the values, i mean in x and y coordinates values? for example if i want to change from 0.1 to 1 or some other values in both coordinates..
Not sure what you mean.
First you have to state if you really need eleven value across horizontally or if start- and endpoint of each horizontal line would be enough.
And then - which value(s) would you like to change? The 0 to 10 across or the upward step of 1?
- Mark as New
- Bookmark
- Subscribe
- Mute
- Subscribe to RSS Feed
- Permalink
- Notify Moderator
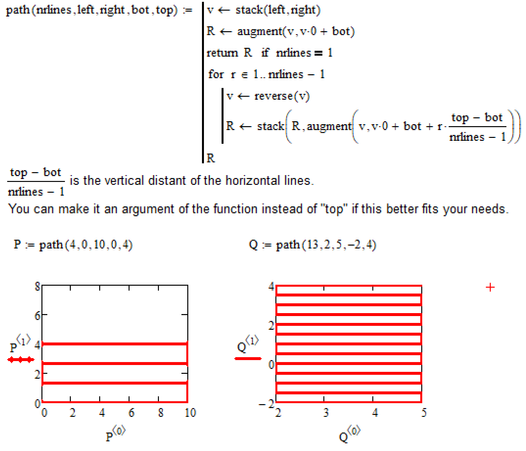
Here is a suggestion - not sure if thats what you have in mind
- Mark as New
- Bookmark
- Subscribe
- Mute
- Subscribe to RSS Feed
- Permalink
- Notify Moderator
it's getting complected but the problem is bit simple, vertical line and horizontal lines can be any number please check this picture.. if don't understand just write me.
- Mark as New
- Bookmark
- Subscribe
- Mute
- Subscribe to RSS Feed
- Permalink
- Notify Moderator
Sorry, its not clear to me what you are trying to achieve.
The matrix at the right of your picture seems to be wrong, I guess, as the values in the second column beginning from row number 22 should be 2, not 1. Right?
? You always need 10 steps horizontally, never more, never less ?
? The horizontal step width is always 1, meaning that the x-values always are just 0,1,2,...10 ?
? You always need 4 steps horizontally (so we have 5 horizontal lines), never more, never less ?
? The only variable value is the vertical distance of the horizontal lines, (the y stepwidth which is 1 in your example but could be any value from 0.1 to 10) ?
- Mark as New
- Bookmark
- Subscribe
- Mute
- Subscribe to RSS Feed
- Permalink
- Notify Moderator
Don't worry about that matrix it's just an example,
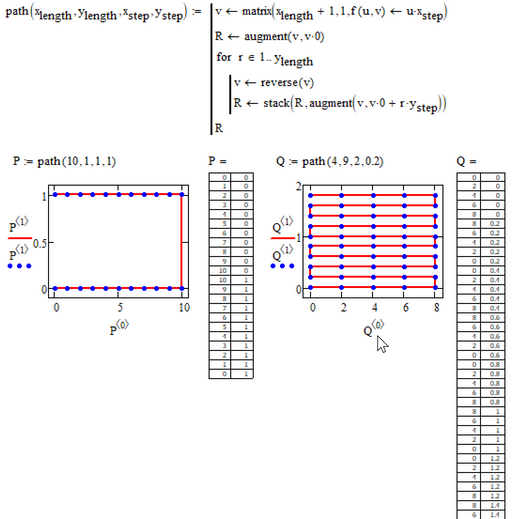
1. "You always need 10 steps horizontally, never more, never less ?" NO, it's not constant value. for example if we create a function "Path(x_length,Y_length)" Here 'x_length', means just length of x here in the picture it's 10 and 'Y_length' means that length of Y in the given matrix (i mean in the picture) it's '2' (because it's 000000000&1111111111)
so lets say if we give a value to this function ("Path(x_length,Y_length)") for example Path(10,1) than i should get check the picture
2. "? The horizontal step width is always 1, meaning that the x-values always are just 0,1,2,...10 " NO, this is also not constant, we can change.
I hope you got i want i'm trying to say.. if not.. it's i will go with One more explanation.
And thanks for response
- Mark as New
- Bookmark
- Subscribe
- Mute
- Subscribe to RSS Feed
- Permalink
- Notify Moderator
@Mathcad111 wrote:
Don't worry about that matrix it's just an example,
I do worry because if it should be an example of what you are looking for it should be correct and include exactly the values you would like the Mathcad function to return.
As far as I can tell from your last post this function should only be dependent on two arguments which you call x_length and y_lengths.
So the values in the matrix would always be integers
in the first column from 0 to x_length
in the second column from 0 to y_length.
But in a picture you had posted you wrote something about a step width of 0.1 in y direction which would mean at least a third argument to the function ??
- Mark as New
- Bookmark
- Subscribe
- Mute
- Subscribe to RSS Feed
- Permalink
- Notify Moderator
Thanks a lot for your time, "But in a picture you had posted you wrote something about a step width of 0.1 in y direction which would mean at least a third argument to the function ??" - Yes, and this problem is solved.


