Community Tip - You can Bookmark boards, posts or articles that you'd like to access again easily! X
- Subscribe to RSS Feed
- Mark Topic as New
- Mark Topic as Read
- Float this Topic for Current User
- Bookmark
- Subscribe
- Mute
- Printer Friendly Page
Curve fitting/Interpolation question
- Mark as New
- Bookmark
- Subscribe
- Mute
- Subscribe to RSS Feed
- Permalink
- Notify Moderator
Curve fitting/Interpolation question
Hi,
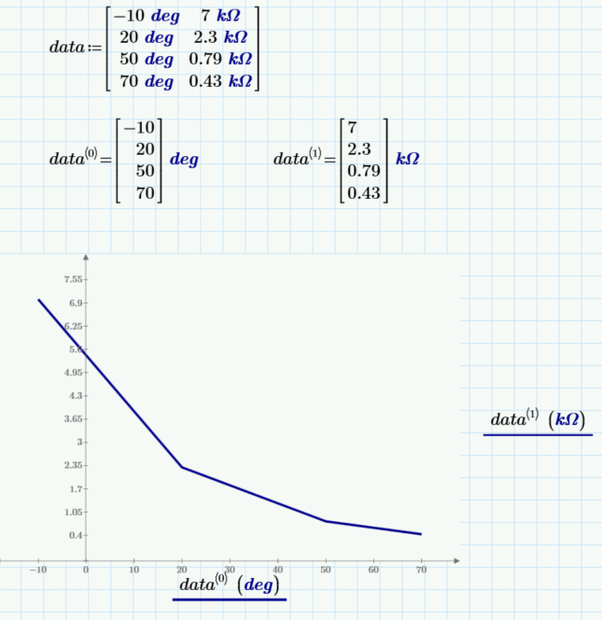
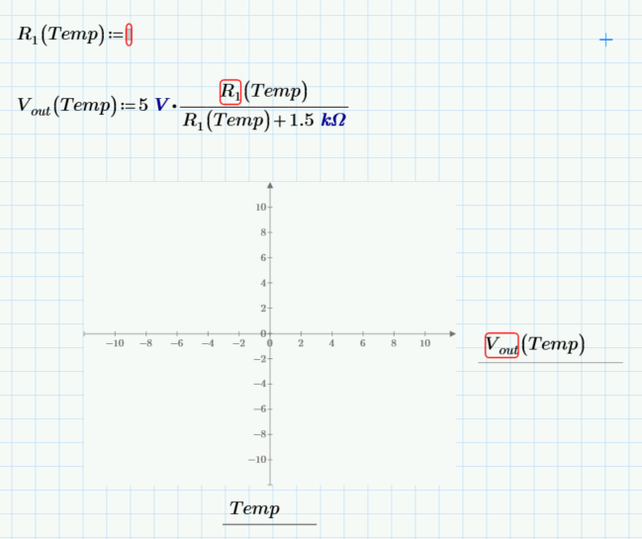
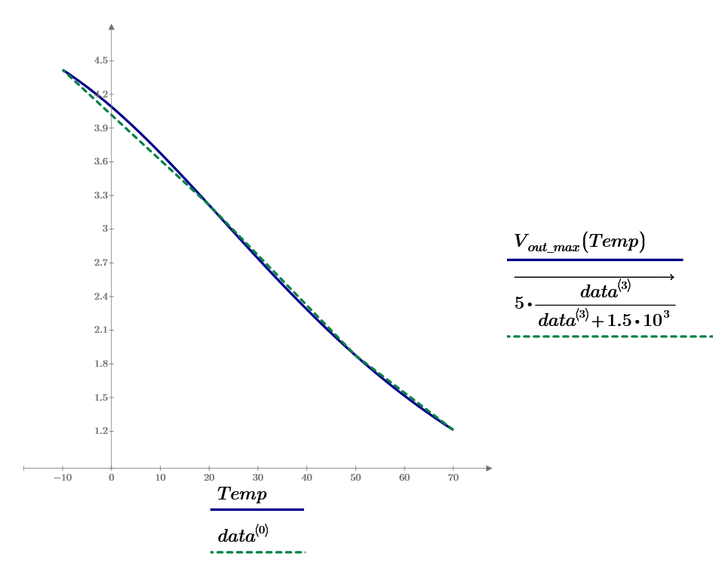
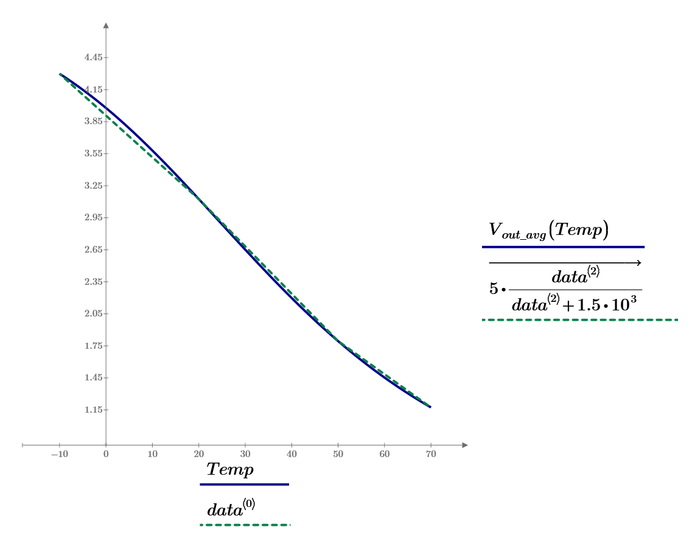
How to find a function that fits to below data. This function is a resistance temperature dependent that will be further involved into another equation (Vout(Temp)), and then how to plot Vout(Temp) vs Temp? Temp is temperature, lets say from -60degC to 90degC. Mathcad Prime 9 fille attached.
Solved! Go to Solution.
- Labels:
-
Electrical_Engineering
-
Mathcad Usage
Accepted Solutions
- Mark as New
- Bookmark
- Subscribe
- Mute
- Subscribe to RSS Feed
- Permalink
- Notify Moderator
As Fred already noticed you mixed up angle degree with degree temperature, presumably °C.
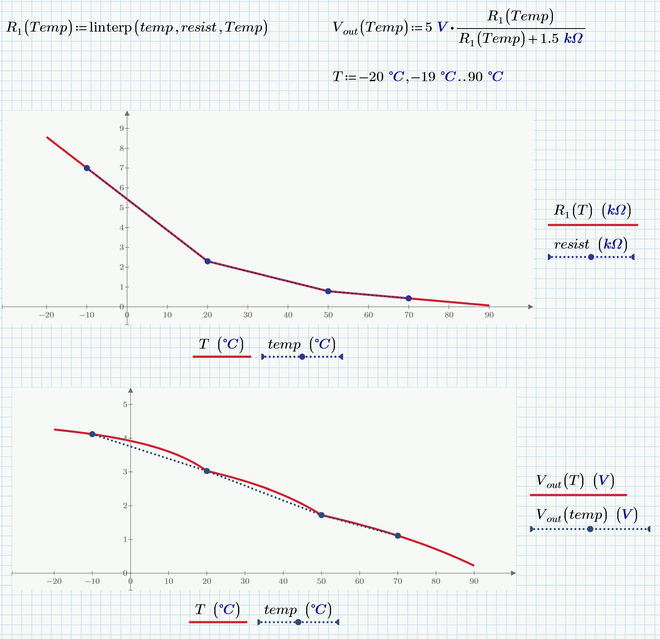
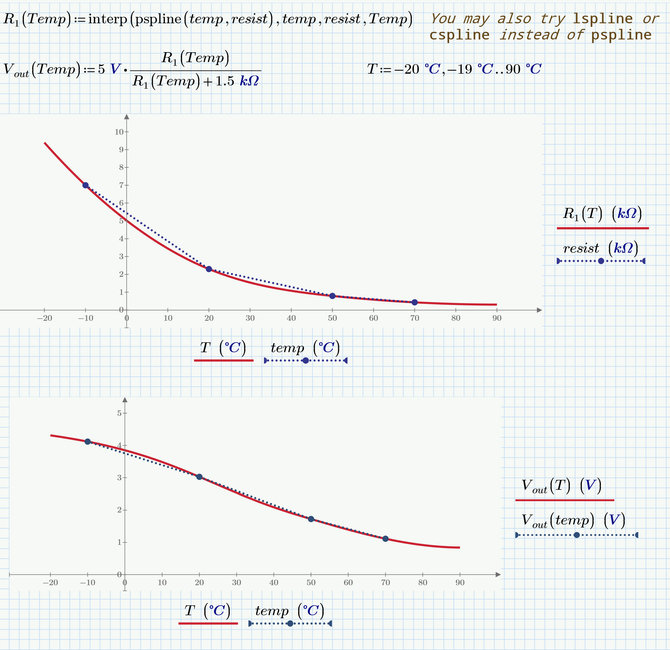
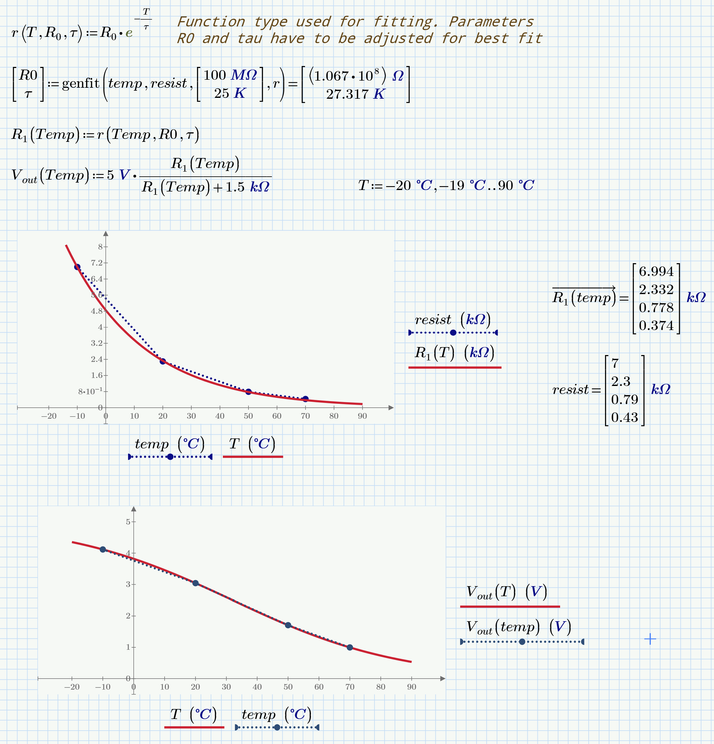
Now you have the choice between an interpolation (the "curve" runs exactly through the given points) or a curve fit, where you choose a function type and Prime tries to adjust the parameters so the overall failure is minimal (least square sum).
The simplest interpolation sure is the linear interpolation:
You may also try a spline interpolation which sometimes is appropriate but sometimes leads to undesired effects
As for a function fit you first would have to decide for a specific function type. Fred decided for a polynomial.
I guessed that an exponential fit might be appropriate. I use the generic "genfit" function for demonstration, but fo a simple exponential fit you may also use the built-in "expfit" function ("expfit" will also accommodate for a vertical displacement).
Note that the standard unit for temperature is Kelvin and its always a good idea to leave it at that because working with temperatures may be quite nasty using °C. So R0 is the resistance at the absolute zero (0 K) and thats the reason for the huge guess value of 100MOhm.
You also can see by the calculation to the right of the first plot that the curve does not run through the points exactly but rather fits them best.
Prime 9 sheet attached
- Mark as New
- Bookmark
- Subscribe
- Mute
- Subscribe to RSS Feed
- Permalink
- Notify Moderator
Attached is an Express 4.0 sheet. A place to start, obviously not quite the right function.
- Mark as New
- Bookmark
- Subscribe
- Mute
- Subscribe to RSS Feed
- Permalink
- Notify Moderator
As Fred already noticed you mixed up angle degree with degree temperature, presumably °C.
Now you have the choice between an interpolation (the "curve" runs exactly through the given points) or a curve fit, where you choose a function type and Prime tries to adjust the parameters so the overall failure is minimal (least square sum).
The simplest interpolation sure is the linear interpolation:
You may also try a spline interpolation which sometimes is appropriate but sometimes leads to undesired effects
As for a function fit you first would have to decide for a specific function type. Fred decided for a polynomial.
I guessed that an exponential fit might be appropriate. I use the generic "genfit" function for demonstration, but fo a simple exponential fit you may also use the built-in "expfit" function ("expfit" will also accommodate for a vertical displacement).
Note that the standard unit for temperature is Kelvin and its always a good idea to leave it at that because working with temperatures may be quite nasty using °C. So R0 is the resistance at the absolute zero (0 K) and thats the reason for the huge guess value of 100MOhm.
You also can see by the calculation to the right of the first plot that the curve does not run through the points exactly but rather fits them best.
Prime 9 sheet attached
- Mark as New
- Bookmark
- Subscribe
- Mute
- Subscribe to RSS Feed
- Permalink
- Notify Moderator
Addendum:
If you feel like me uncomfortable with the guess value at 0 Kelvin you may use a slightly different function which is shifted by 0°C. Now R0 is the resistance a 0°C which can be guessed from the given data to be around 5 kOhm.
- Mark as New
- Bookmark
- Subscribe
- Mute
- Subscribe to RSS Feed
- Permalink
- Notify Moderator
@Werner_E What will be the value for
Werner I need the function R1(Temp)...what are the constants a0 and a1:
- Mark as New
- Bookmark
- Subscribe
- Mute
- Subscribe to RSS Feed
- Permalink
- Notify Moderator
....
Werner I need the function R1(Temp)...what are the constants a0 and a1:
You have just shown these constants yourself when you symbolically evaluated the function.
You also see it when you evaluate R1 and tau
If you use the shifted function where a0=R0 is the resistance for 0°C, then a0=R0=4.85 kOhm and a1=-1/tau=1/27.317 K =-0.0366 / K
But the function must be written as a0*e^(a1*(Temp-0°C)).
If you insist on a0*e^(a1*Temp) then you have to use the values shown in my first sheet, where R0=a0 is the resistance at absolute zero (0 Kelvin).
- Mark as New
- Bookmark
- Subscribe
- Mute
- Subscribe to RSS Feed
- Permalink
- Notify Moderator
And for this:
- Mark as New
- Bookmark
- Subscribe
- Mute
- Subscribe to RSS Feed
- Permalink
- Notify Moderator
Oh, yes, thank you both.
- Mark as New
- Bookmark
- Subscribe
- Mute
- Subscribe to RSS Feed
- Permalink
- Notify Moderator
- Mark as New
- Bookmark
- Subscribe
- Mute
- Subscribe to RSS Feed
- Permalink
- Notify Moderator
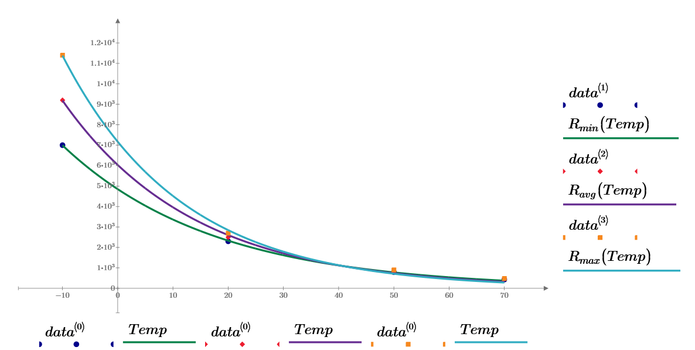
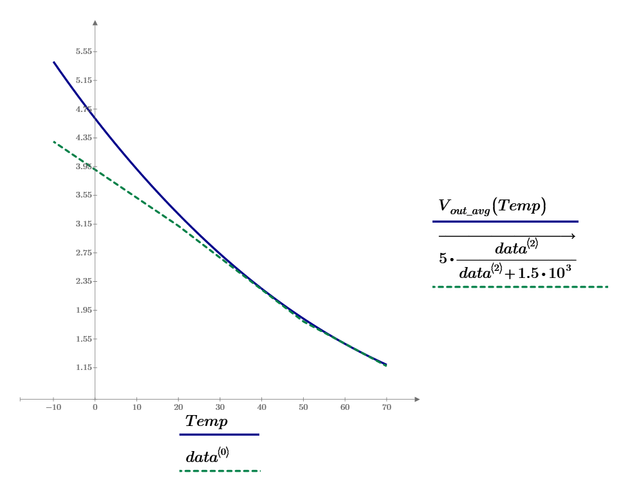
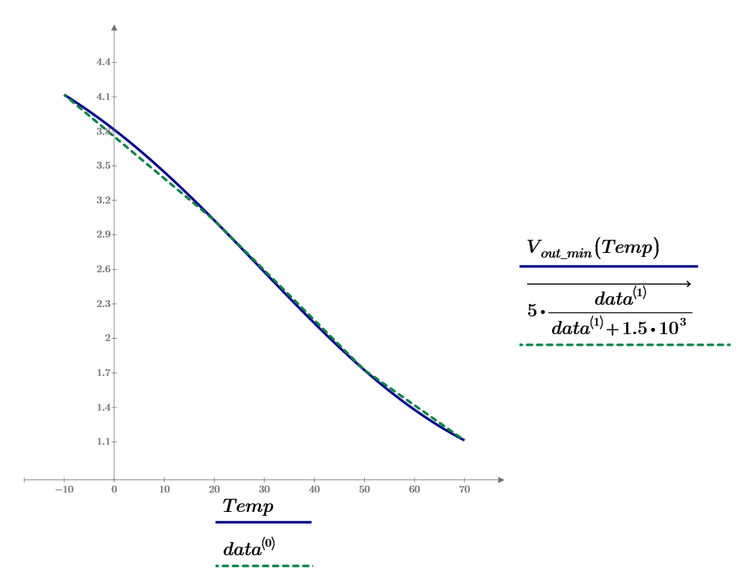
Update sheet - see attached MCP9. This is somewhat bad, look what much error there is at low temperature:
For the remaining two its ok:
- Mark as New
- Bookmark
- Subscribe
- Mute
- Subscribe to RSS Feed
- Permalink
- Notify Moderator
- Mark as New
- Bookmark
- Subscribe
- Mute
- Subscribe to RSS Feed
- Permalink
- Notify Moderator
- Mark as New
- Bookmark
- Subscribe
- Mute
- Subscribe to RSS Feed
- Permalink
- Notify Moderator
@Werner_E Here is my approach. Please let me know your thoughts and if you find another way...Mathcad Prime 9 file attached. Its strange with this K (Kelvin), and that Mathcad doesn't let it do operations directly in degrees celsius, and display in degrees celsius..For example
This is for -10 degree Celsius
- Mark as New
- Bookmark
- Subscribe
- Mute
- Subscribe to RSS Feed
- Permalink
- Notify Moderator
My sheets used units anyway - what was wrong with them?
I would prefer the approach in the attached sheet
- Mark as New
- Bookmark
- Subscribe
- Mute
- Subscribe to RSS Feed
- Permalink
- Notify Moderator
Using your data, I try to curve fitting by below functions.
At first I made interpolate data by log(time).
Then try to use expfit, polyfit, genfit, etc..
Finally, rationalfit can fit both magnitude and phase data.
- Mark as New
- Bookmark
- Subscribe
- Mute
- Subscribe to RSS Feed
- Permalink
- Notify Moderator
Attache the sheet..
- Mark as New
- Bookmark
- Subscribe
- Mute
- Subscribe to RSS Feed
- Permalink
- Notify Moderator
I still study Rational Function Regression. You can find it by Mathcad help.
rationalfit(vx, vy, conf, m, n, [Stdy], [LBUB], [Acc], ["noscale"])
m=5 and n=5 are OK to fit well.

