Community Tip - Learn all about PTC Community Badges. Engage with PTC and see how many you can earn! X
- Subscribe to RSS Feed
- Mark Topic as New
- Mark Topic as Read
- Float this Topic for Current User
- Bookmark
- Subscribe
- Mute
- Printer Friendly Page
Curve fitting - rationalfit problem, error
- Mark as New
- Bookmark
- Subscribe
- Mute
- Subscribe to RSS Feed
- Permalink
- Notify Moderator
Curve fitting - rationalfit problem, error
Hello,
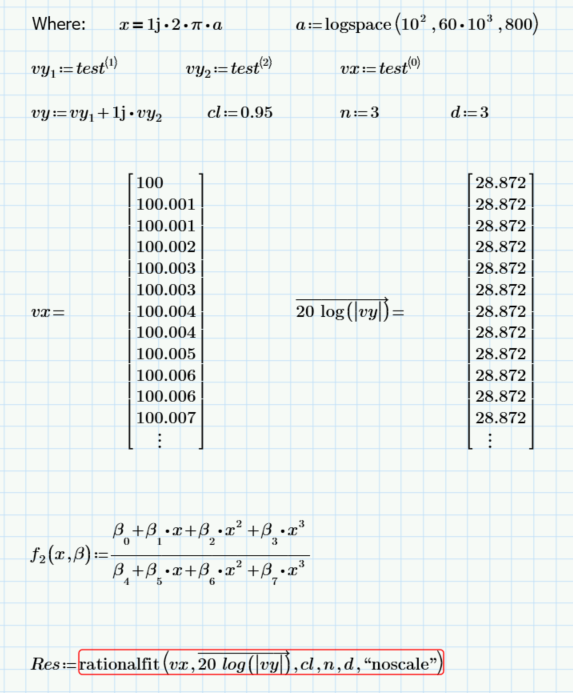
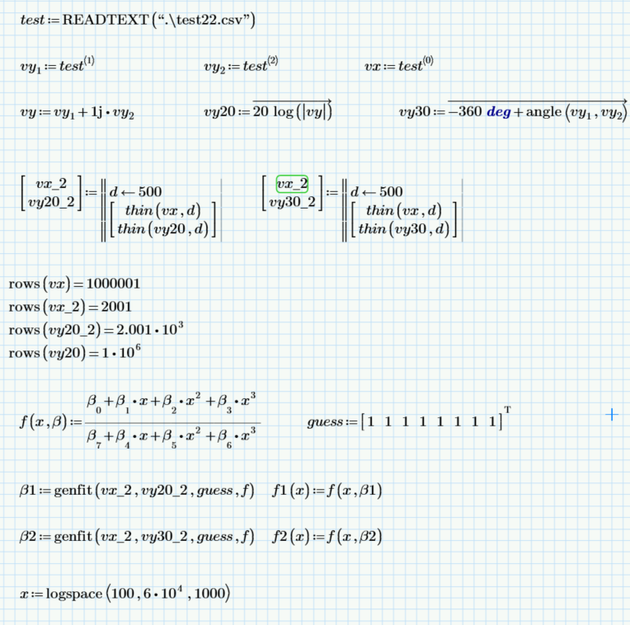
See attached Mathcad Prime 9 file. I am trying to make a fitting function for below data, but I received this error:
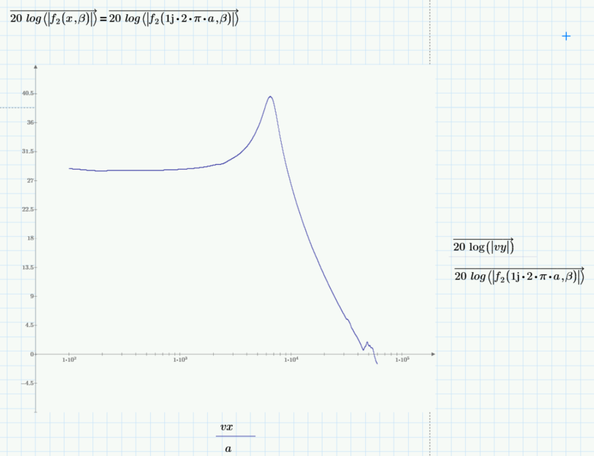
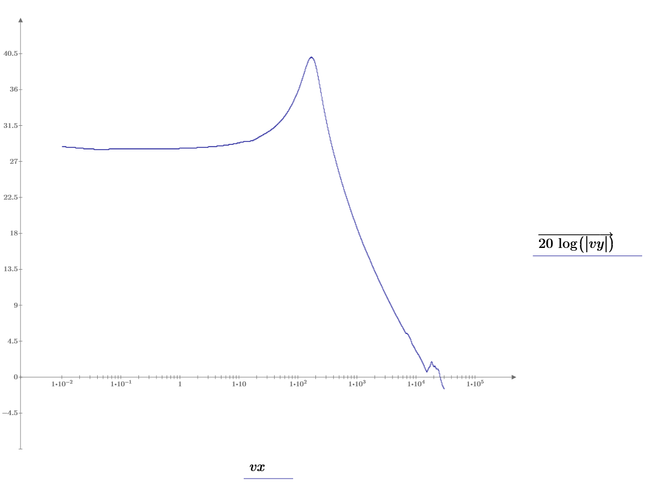
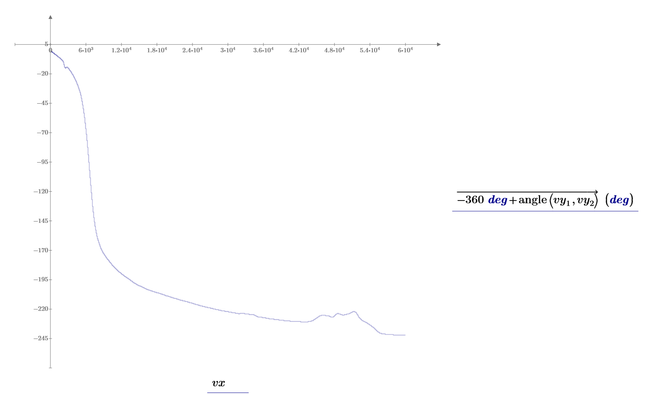
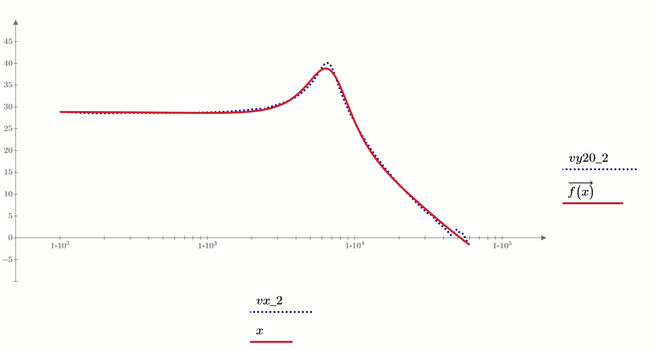
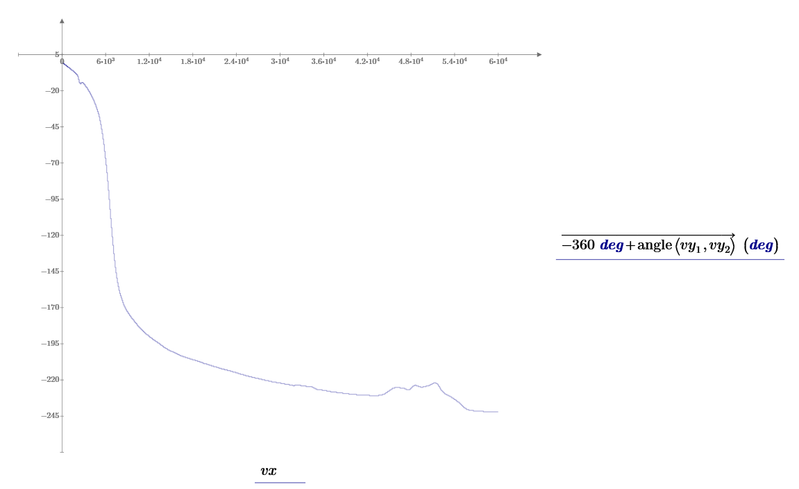
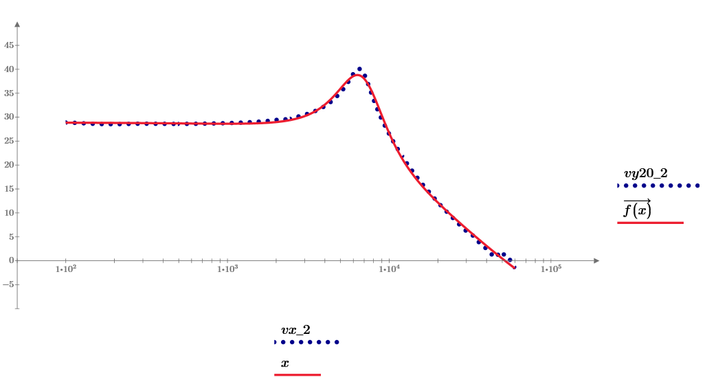
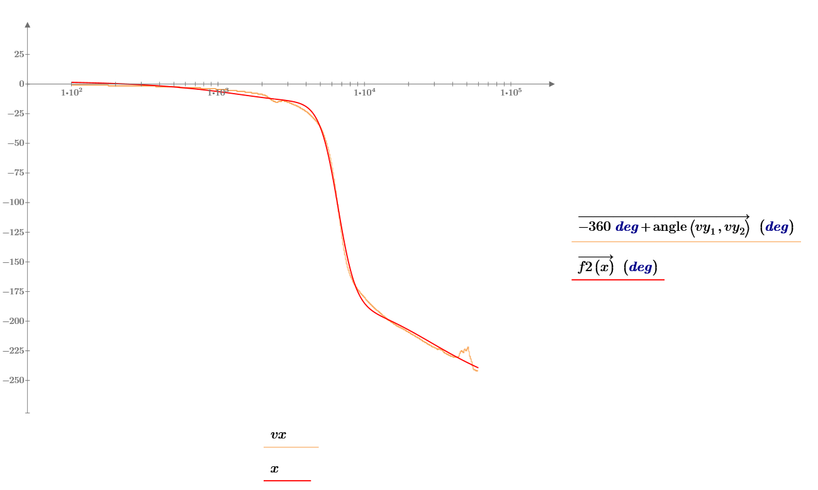
So, with above given data I want to find a rational function that fit the data points, see below plots:
Solved! Go to Solution.
- Labels:
-
Electrical_Engineering
-
Mathcad Usage
Accepted Solutions
- Mark as New
- Bookmark
- Subscribe
- Mute
- Subscribe to RSS Feed
- Permalink
- Notify Moderator
That's disappointing! "rationalfit" is overwhelmed with vectors with just one million entries.
But vectors that large seem to be too much for "genfit", as well. At least it seemed to be running forever and I stopped the calculation - not sure if it ever would finish or throw an error.
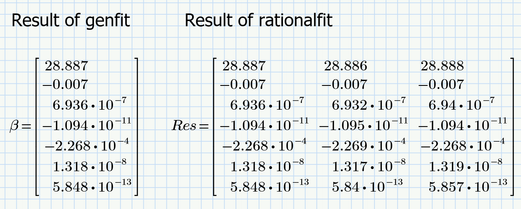
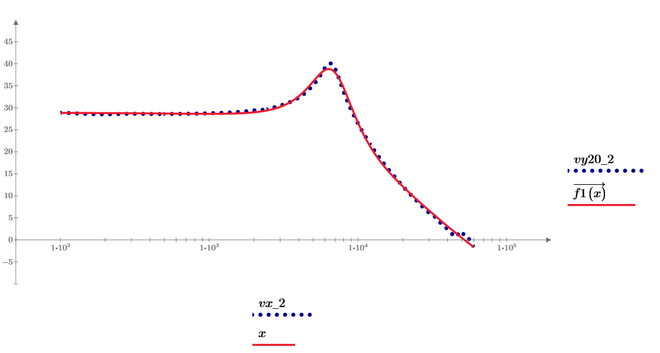
I thinned the data to just 2000 elements by only using every 500th entry and both "genfit" and "rationalfit" worked OK and give us the very same result.
- Mark as New
- Bookmark
- Subscribe
- Mute
- Subscribe to RSS Feed
- Permalink
- Notify Moderator
And how to plot also the second plot? There is a way of doing this?
- Mark as New
- Bookmark
- Subscribe
- Mute
- Subscribe to RSS Feed
- Permalink
- Notify Moderator
Simply find out how the expression you a´want to plot relates to the already found function f or make a separate second curve fit for this data similar to the first one.
As you can't reconstruct vy1 and vy2 just from vy, I guess you would have to resort to the second approach.
Another way would be to first make two separate curve fits for vy1 and vy2 and use this for both plots.
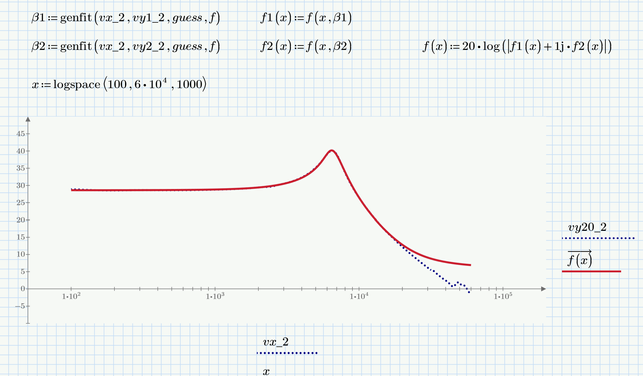
The result of this approach is not as desired:
The reason may be the simple linear thinning which leaves more data in the lower range and less in the upper one. So the upper range is much less respected by the genfit algorithm.
You may consider writing a more sophisticated "thinning" function which compensates for that.
Good luck!
- Mark as New
- Bookmark
- Subscribe
- Mute
- Subscribe to RSS Feed
- Permalink
- Notify Moderator
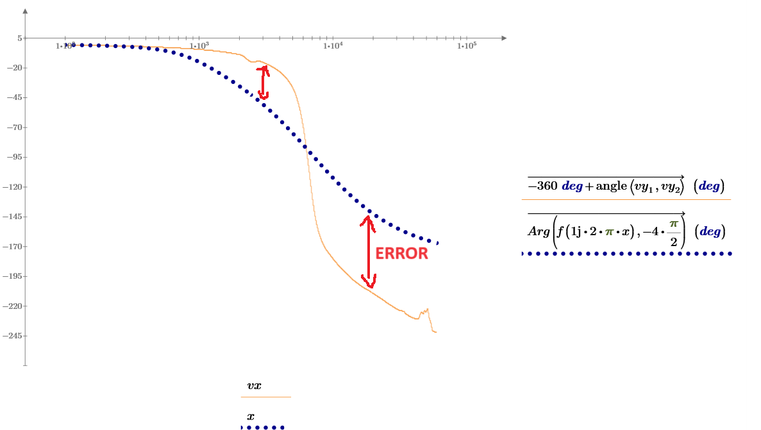
Hm...what error gives between the fitting function and data points for the second plot...even though first plot is ok.
@ttokoro we need here also you to join us. do you have any idea?
Second plot:
First plot
- Mark as New
- Bookmark
- Subscribe
- Mute
- Subscribe to RSS Feed
- Permalink
- Notify Moderator
Too bad!
But i wonder why you think that you could reconstruct the angle using just x and f(x)? It looks to me that you are trying to get the phase diagram but just knowing the magnitudes - thats a mission impossible.
Furthermore the function f is a function which takes a real argument x. Why do you think this very same function would give meaningful results if you feed it with a non-real argument like 1j*2 pi*x ???
- Mark as New
- Bookmark
- Subscribe
- Mute
- Subscribe to RSS Feed
- Permalink
- Notify Moderator
I see, I figure out also for the second plot how can be done:
- Mark as New
- Bookmark
- Subscribe
- Mute
- Subscribe to RSS Feed
- Permalink
- Notify Moderator
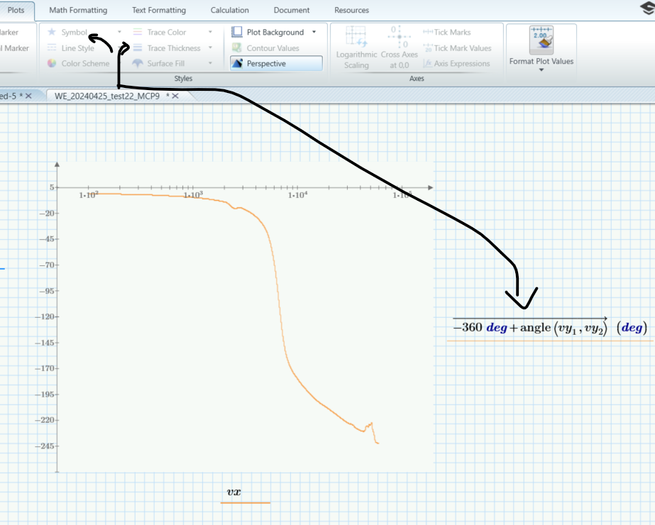
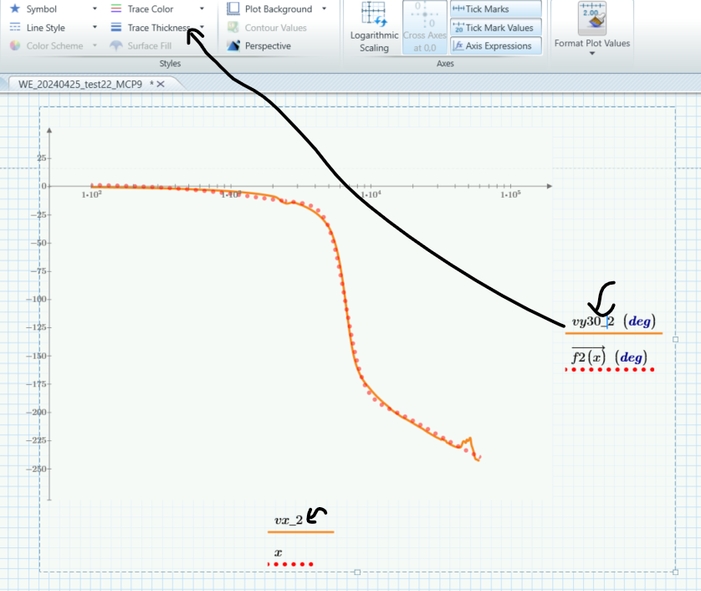
I see that trace thickness cannot be used. Is there a way to make available trace thickness in this example? There are no sufficient points? Or?
EDIT: Its ok now, I saw why I cannot from the first time:
- Mark as New
- Bookmark
- Subscribe
- Mute
- Subscribe to RSS Feed
- Permalink
- Notify Moderator
Hm, also I am trying with LeastSquaresFit, but I see that Mathcad is thinking forever with this variant...Do you think that is it not possible also with this LeastSquaresFit?
- Mark as New
- Bookmark
- Subscribe
- Mute
- Subscribe to RSS Feed
- Permalink
- Notify Moderator
So @Werner_E the only question so far is this with LeastSquaresFit, why is not working, if there is a reason
- Mark as New
- Bookmark
- Subscribe
- Mute
- Subscribe to RSS Feed
- Permalink
- Notify Moderator
@Cornel wrote:
So @Werner_E the only question so far is this with LeastSquaresFit, why is not working, if there is a reason
rationalfit and also LeastSquaresFit seem to be very very slow functions - maybe because of the range they return depending on the desired confidence level. Its also very disappointing that those functions seem to have so much troubles with larger data vectors. Not what I would expect from a number cruncher which Mathcad used to be.
I never used those functions and I don't know how they are implemented. You may try with even less data (set d <- 1000 (or larger) to use just every 1000th vector element) and see if the function works with less data. Maybe it just takes hours and finally the function would return a result - I don't know and sure don't have the necessary patience 😉
You may also do your own least square fit by setting up the squared error function and use a solve block with minerr.
I don't think that the results would be much different from those given by genfit.
- Mark as New
- Bookmark
- Subscribe
- Mute
- Subscribe to RSS Feed
- Permalink
- Notify Moderator
In your fuction f the argument beta7 is obsolete and should be normalized to 1 as in my sheet. Otherwise any multiple of a specific octuple of values beta would yield the very same function. Thats the reason its set up exactly that way in "rationalfit" See: Rational Function Regression
I thinned the data extremely up to vectors of just 667 elements and LeastSquresFit finally finishes (took much! longer than genfit).
The results were different, though. See yourself:
- Mark as New
- Bookmark
- Subscribe
- Mute
- Subscribe to RSS Feed
- Permalink
- Notify Moderator
Reduce the data point to plot and try and error to get the results you want.

