- Subscribe to RSS Feed
- Mark Topic as New
- Mark Topic as Read
- Float this Topic for Current User
- Bookmark
- Subscribe
- Mute
- Printer Friendly Page
Curve fitting
- Mark as New
- Bookmark
- Subscribe
- Mute
- Subscribe to RSS Feed
- Permalink
- Notify Moderator
Curve fitting
Dear experts,
I have a question about curve fitting by using Mathcad.
I have a formula call Steinmetz's equation.
if I have a data like below figure.
Based on the Steinmetz's equation, I want to solve the "a" ,"b" and "k" from each frequency.
how do I use Mathcad to do the curve fitting.
Could you please give me some example.
Solved! Go to Solution.
- Labels:
-
Electrical_Engineering
-
Mathcad Usage
Accepted Solutions
- Mark as New
- Bookmark
- Subscribe
- Mute
- Subscribe to RSS Feed
- Permalink
- Notify Moderator
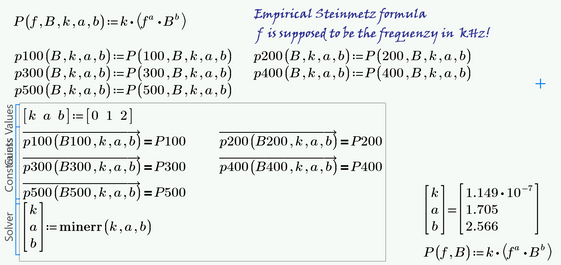
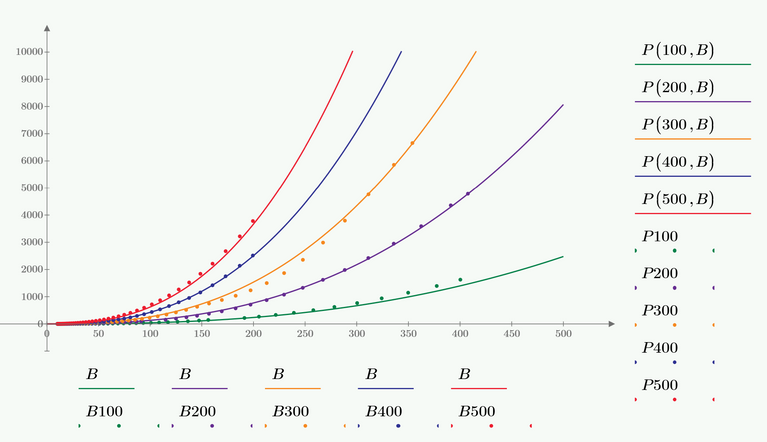
Here is an attempt to calculate just one set of parameters (a,b,k) which should fit all five curves.
The solve block used is not very sensible with respect to the guess values.
As you can see in the following plots, the fit isn't equally good for all curves. Of course you get better fits if you derive the parameters for each curve separately.
Attached sheet is in format Prime 6
- Mark as New
- Bookmark
- Subscribe
- Mute
- Subscribe to RSS Feed
- Permalink
- Notify Moderator
Looking up the information in he help about the function genfit() should help you.
- Mark as New
- Bookmark
- Subscribe
- Mute
- Subscribe to RSS Feed
- Permalink
- Notify Moderator
Got it.
- Mark as New
- Bookmark
- Subscribe
- Mute
- Subscribe to RSS Feed
- Permalink
- Notify Moderator
From "Help Center" - "About Curve Fitting Functions": https://support.ptc.com/help/mathcad/r9.0/en/index.html#page/PTC_Mathcad_Help/about_curve_fitting_functions.html
- Mark as New
- Bookmark
- Subscribe
- Mute
- Subscribe to RSS Feed
- Permalink
- Notify Moderator
thanks.
- Mark as New
- Bookmark
- Subscribe
- Mute
- Subscribe to RSS Feed
- Permalink
- Notify Moderator
Please share your Mathcad sheet that has your plot data set.
- Mark as New
- Bookmark
- Subscribe
- Mute
- Subscribe to RSS Feed
- Permalink
- Notify Moderator
I know how to do it, thanks.
- Mark as New
- Bookmark
- Subscribe
- Mute
- Subscribe to RSS Feed
- Permalink
- Notify Moderator
- Mark as New
- Bookmark
- Subscribe
- Mute
- Subscribe to RSS Feed
- Permalink
- Notify Moderator
Hi @ttokoro
May I know what's kind of method did you use?
is it possible to share your Mathcad, thanks.
- Mark as New
- Bookmark
- Subscribe
- Mute
- Subscribe to RSS Feed
- Permalink
- Notify Moderator
I just use Werner_E's solve block and also the one of Fred's log data to 3D plot data.
- Mark as New
- Bookmark
- Subscribe
- Mute
- Subscribe to RSS Feed
- Permalink
- Notify Moderator
it seems like the method you use is more accurate?
- Mark as New
- Bookmark
- Subscribe
- Mute
- Subscribe to RSS Feed
- Permalink
- Notify Moderator
@J_power wrote:
it seems like the method you use is more accurate?
Why do you think so?
For a comparison of the two fits see here: https://community.ptc.com/t5/Mathcad/Curve-fitting/m-p/895688/highlight/true#M208272
- Mark as New
- Bookmark
- Subscribe
- Mute
- Subscribe to RSS Feed
- Permalink
- Notify Moderator
- Mark as New
- Bookmark
- Subscribe
- Mute
- Subscribe to RSS Feed
- Permalink
- Notify Moderator
Hi,
Part of the input for the 'genfit()' function are two column vectors vx and vy being the data you intend fitting to.
So my question is do you have the original data that forms the graph or are you working only on an image of the graph?
If you only have the graph you will need a program like PlotDigitize to get some x,y values. That is what I have done here.
- Mark as New
- Bookmark
- Subscribe
- Mute
- Subscribe to RSS Feed
- Permalink
- Notify Moderator
I have original data.
Thanks for your advice. I know how to do.
by the way, I have other question.
if I have 5 curve in one plot.
could I use genfit to find the coefficient?
for example,
in your plot, you only draw 1150Hz curve in Mathcad and you use genfit to find the coefficient.
can I draw the all frequency to find the coefficient?
- Mark as New
- Bookmark
- Subscribe
- Mute
- Subscribe to RSS Feed
- Permalink
- Notify Moderator
Hi,
You need to use genfit() five times to get the coefficients. One for each line on the curve.
If the data was organised with vx being a matrix with each column being the B data for one line and vy being a matrix with each column being the data for one line in turn, you can use one genfit solution. This would generate a nested matrix of k, a, b solutions.
Cheers
- Mark as New
- Bookmark
- Subscribe
- Mute
- Subscribe to RSS Feed
- Permalink
- Notify Moderator
Hi,
Do you mean I will get k,a,b coefficient for each curve or I will get total solution for five curve.h version
by the way,
which Mathcad Prime version you use, I use 7, but I couldn't open it.
and I can't use genfit function in Mathcad 7 prime.
- Mark as New
- Bookmark
- Subscribe
- Mute
- Subscribe to RSS Feed
- Permalink
- Notify Moderator
Hi,
Do you mean I will get k,a,b coefficient for each curve or I will get total solution for five curve.h version
Yes you get five different coefficients one for each line.
Sorry Prime 9 only
Cheers
Terry
- Mark as New
- Bookmark
- Subscribe
- Mute
- Subscribe to RSS Feed
- Permalink
- Notify Moderator
Hi
Is it possible to find a general solution for five all curve?
or other method I can find the general solution for these.
because it is not very convenient to find the solution for each curve.
- Mark as New
- Bookmark
- Subscribe
- Mute
- Subscribe to RSS Feed
- Permalink
- Notify Moderator
- Mark as New
- Bookmark
- Subscribe
- Mute
- Subscribe to RSS Feed
- Permalink
- Notify Moderator
Hi @LucMeekes ,
Thanks.
the genfit() function could be used in Mathcad Prime 7? I search the Prime 7 document, there is no genfit() in there.
may I know how you transfer the version from 9 to 7?
- Mark as New
- Bookmark
- Subscribe
- Mute
- Subscribe to RSS Feed
- Permalink
- Notify Moderator
@J_power wrote:
the genfit() function could be used in Mathcad Prime 7? I search the Prime 7 document, there is no genfit() in there.
Prime 7 definitely has "genfit" built in. See the help page here: Nonlinear Regression
As its a "premium" function its not available if you are using the free Express version of Prime. So, do you use the full version or Prime Express? In the latter case you may have a look at Freds reply.
Is it possible to find a general solution for five all curve?
Yes, thats possible. Why don't you post the data?
- Mark as New
- Bookmark
- Subscribe
- Mute
- Subscribe to RSS Feed
- Permalink
- Notify Moderator
Hi @Werner_E ,
OK, I know it. I can open it now.
please see the attached file.
this is my data points.
- Mark as New
- Bookmark
- Subscribe
- Mute
- Subscribe to RSS Feed
- Permalink
- Notify Moderator
Hi @terryhendicott ,
When I open your v2 file, it think you don't use the method you mention, right?
it seems you define the new data.
how do I define the 5 different data only using vx.
- Mark as New
- Bookmark
- Subscribe
- Mute
- Subscribe to RSS Feed
- Permalink
- Notify Moderator
From where did you get that graph: Loss vs B (from which book/site/article/etc)? Do you only have the picture or also the data points?
- Mark as New
- Bookmark
- Subscribe
- Mute
- Subscribe to RSS Feed
- Permalink
- Notify Moderator
- Mark as New
- Bookmark
- Subscribe
- Mute
- Subscribe to RSS Feed
- Permalink
- Notify Moderator
Express does not have access to "genfit." But, by taking the logarithm of the equation we can turn it into something that least squares can deal with. Attached is a sample in version 4.
Note that only one curve's data was used to develop the solution. If the constants (k, a, b) are true physical parameters then the curves for other frequencies should also be correct.
- Mark as New
- Bookmark
- Subscribe
- Mute
- Subscribe to RSS Feed
- Permalink
- Notify Moderator
Hi,
By the way Fred how did you get the red area line?
Fred's log techniue
genfit with start guess of 1,1,1. You can get a different k,a,b by changing the guess values
So there are many solutions for k,a,b on the one curve. meaning it may be possible for one set of k,a,b for all curves
Please upload you data
- Mark as New
- Bookmark
- Subscribe
- Mute
- Subscribe to RSS Feed
- Permalink
- Notify Moderator
Hi @terryhendicott ,
Sorry too late to upload the data.
please see the attached file.
I have five curve with different frequency in Excel file.
but I still can only find the solution case by case,
- Mark as New
- Bookmark
- Subscribe
- Mute
- Subscribe to RSS Feed
- Permalink
- Notify Moderator
Terry,
The red line at the top is a collapsed area that has errors inside it. (Express is missing a lot of useful functions and gimmicks; I put them in a collapsed area at the top so they're there when I need them. Turns out one expression has an error, so the area line turns red.


