Community Tip - Have a PTC product question you need answered fast? Chances are someone has asked it before. Learn about the community search. X
- Subscribe to RSS Feed
- Mark Topic as New
- Mark Topic as Read
- Float this Topic for Current User
- Bookmark
- Subscribe
- Mute
- Printer Friendly Page
Curve fitting
- Mark as New
- Bookmark
- Subscribe
- Mute
- Subscribe to RSS Feed
- Permalink
- Notify Moderator
Curve fitting
Dear experts,
I have a question about curve fitting by using Mathcad.
I have a formula call Steinmetz's equation.
if I have a data like below figure.
Based on the Steinmetz's equation, I want to solve the "a" ,"b" and "k" from each frequency.
how do I use Mathcad to do the curve fitting.
Could you please give me some example.
Solved! Go to Solution.
- Labels:
-
Electrical_Engineering
-
Mathcad Usage
- Mark as New
- Bookmark
- Subscribe
- Mute
- Subscribe to RSS Feed
- Permalink
- Notify Moderator
@terryhendicott wrote:genfit with start guess of 1,1,1. You can get a different k,a,b by changing the guess values
So there are many solutions for k,a,b on the one curve. meaning it may be possible for one set of k,a,b for all curves
Hi TERRY,
Do you know if there is other method for those kind of problems of curve fitting in which to not be constraint to use guess values? If there is no other method for such problems, then my question is how someone does know how to better guess these guess values or how to guess these guess values? Or does not matter what values someone will put as guess values?
- Mark as New
- Bookmark
- Subscribe
- Mute
- Subscribe to RSS Feed
- Permalink
- Notify Moderator
Should I care this red area?
Sorry, I don't very understand two parts.
I see you take the log in A,B,P. why we do that. and what does MA and MAP mean.
- Mark as New
- Bookmark
- Subscribe
- Mute
- Subscribe to RSS Feed
- Permalink
- Notify Moderator
Jason,
The red area (like I told Terry) is there to put back some of the things Express is missing. Feel free to look, but you don't need to worry about what's inside. If I convert your Steinmetz equation into log form it becomes a simple linear equation in two variables. This equation can be solved by least squares method for a range of B and the corresponding range of Pv. I chose to do it via matrices, which is where MA and MAP (and MAb) come in. This gives us ln(k), a, and b directly; so we can populate the Steinmetz equation.
I'll try your data tomorrow. . .
- Mark as New
- Bookmark
- Subscribe
- Mute
- Subscribe to RSS Feed
- Permalink
- Notify Moderator
- Mark as New
- Bookmark
- Subscribe
- Mute
- Subscribe to RSS Feed
- Permalink
- Notify Moderator
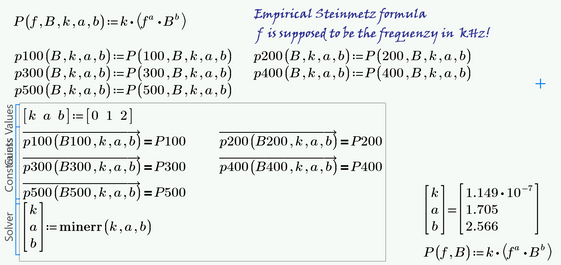
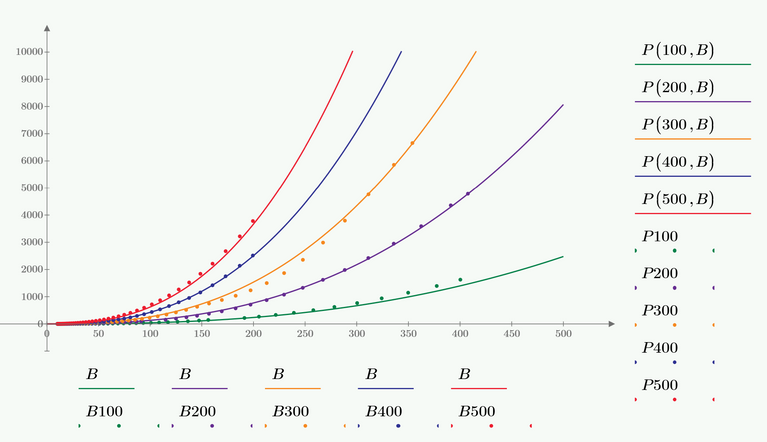
Here is an attempt to calculate just one set of parameters (a,b,k) which should fit all five curves.
The solve block used is not very sensible with respect to the guess values.
As you can see in the following plots, the fit isn't equally good for all curves. Of course you get better fits if you derive the parameters for each curve separately.
Attached sheet is in format Prime 6
- Mark as New
- Bookmark
- Subscribe
- Mute
- Subscribe to RSS Feed
- Permalink
- Notify Moderator
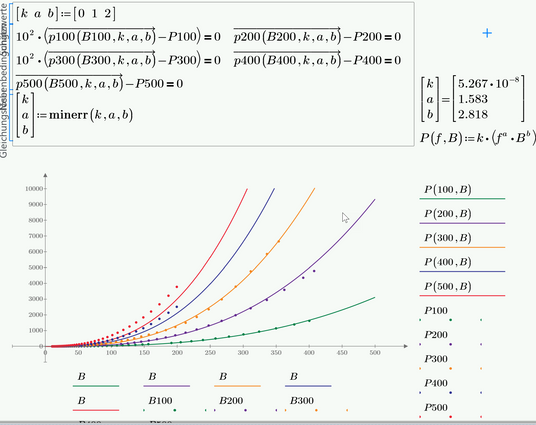
As the the fit for frequencies 100 KHz and 300 kHz is worst, you can "weight" the conditions for these frequencies by multiplying the difference by a larger value so that they are are considered more than the others. The fit is now better for these two frequencies but much worse for the others, especially 400KHz and 500 kHz.
You may play around with different "weights" but the best overall fit (apart from fitting each curve separately) seems to be provided with equal weight for all as in my initial posting.
- Mark as New
- Bookmark
- Subscribe
- Mute
- Subscribe to RSS Feed
- Permalink
- Notify Moderator
Fred first suggested to take the logarithm of the equation and do the fit then. Also ttokoro showed the result of this approach.
You must keep in mind the the results are not the same as when doing the fit with the original, unlogarithmized data.
Taking the log and then doing a least squared errors fit weights the errors for larger values less (because the fitting algorithm is using the absolute value of the errors and due to the log they are now smaller). This may not matter or even may be desired but it also may be not appropriate. It depends and its up to you to decide if you want this to be done or not.
I have added the log-fit to my sheet and you may compare (the log fit is the one with the functions P2
The differences are not huge, but noticeable, especially for the lower frequencies 100kHz and 200 kHz which use higher values of B.
The differences can also be observed in a log-log-plot where we have linear functions
Modified sheet in Prime 6 format attached
- Mark as New
- Bookmark
- Subscribe
- Mute
- Subscribe to RSS Feed
- Permalink
- Notify Moderator
Hi @Werner_E ,
Thanks for your explanation.
it seems like I am not very clear about the method of least squared errors fit.
I will study it more.
- Mark as New
- Bookmark
- Subscribe
- Mute
- Subscribe to RSS Feed
- Permalink
- Notify Moderator
- Mark as New
- Bookmark
- Subscribe
- Mute
- Subscribe to RSS Feed
- Permalink
- Notify Moderator
The data sets in your Excel file are not all of same length. When I read in the full data and extract the single columns, some columns have NaN (Not-a-Number) entries at the end to get them all the same length. The built-in function filterNaN( ) deletes the rows which contain just NaN's, which is what i want. But the built-in function throws an error if its applied to a vector which does not contain any NaN's.
So I build my own FilterNaN( ) (note the capital "F") which tries to apply the built-in function (lower case "f") and if it fails it simply returns the vector/matrix unchanged. So I can use this function without having to think about if a vector would contain an NaN or not.
- Mark as New
- Bookmark
- Subscribe
- Mute
- Subscribe to RSS Feed
- Permalink
- Notify Moderator
Got it, thanks!
- « Previous
-
- 1
- 2
- Next »


