Community Tip - Need to share some code when posting a question or reply? Make sure to use the "Insert code sample" menu option. Learn more! X
- Subscribe to RSS Feed
- Mark Topic as New
- Mark Topic as Read
- Float this Topic for Current User
- Bookmark
- Subscribe
- Mute
- Printer Friendly Page
Determination by deriving a bending moment function (error message)
- Mark as New
- Bookmark
- Subscribe
- Mute
- Subscribe to RSS Feed
- Permalink
- Notify Moderator
Determination by deriving a bending moment function (error message)
Hello, I have a beam with a triangular line load. For this task I wanted to visualize the existing Mb curve using a My curve. I created this with partial functions. So far so good. As a further step in my task, I wanted to use Mathcad 15.0 to determine the location of the greatest bending moment. From a purely mathematical point of view, this corresponds to zeroing the 1st derivative (lateral force). Everything is clear from the logical understanding to the procedure. Unfortunately, from this point on it does not work completely smoothly and without problems. Because I have created a new definition with the derivation and function including the run variable specified for the derivation. Then I wanted to use the symbolic commands "Coefficients" to output the existing values and to have the 2 possible zeros displayed again with the additional "Set to zero" function. Unfortunately, when performing these steps, I always get the error message that there is "more than one independent variable". Although the designation and definition of the entire variable including units would be correct. I have attached the file including screenshots of the problem addressed. As an appendix for my problem, I also wanted to ask what it is all about when I have values calculated using the symbolic equal sign and these are completely overflowing with various units. After doing some research I saw a post here in the forum and have the same problem. (https://ww3.cad.de/foren/ubb/Forum479/HTML/000449.shtml) Is there already a solution for this or is it just the behavior of MC? I would like to thank you very much for advice or help. Unfortunately, I'm already very desperate and after researching Google etc. I don't know what to do next. Many Thanks.
- Labels:
-
Mathcad Usage
- Mark as New
- Bookmark
- Subscribe
- Mute
- Subscribe to RSS Feed
- Permalink
- Notify Moderator
The main problem here is unfortunately the usage of the units.
The "coeffs" command correctly works symbolically as you can see if you symbolically evaluate "f":
The red error is because the numerics does not allow vectors or matrices where the elements are of different dimensions and f has three different ones - force, dimensionless and pressure.
This is also the reason why the "polyroots" command fails.
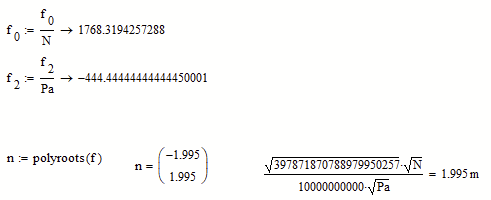
You may make all elements of "f" dimensionless by dividing through the appropriate units (you must evaluate symbolically!) - then "polyroots" works ok and gives the same result as your following alternate method:
Some remarks:
- You defines a variable q:=4 kN/m and later a function q(x.1). You shouldn't do that because on one hand its bad habit to use the same name for different things in the same calculation and it also confuses Mathads symbolic engine. I rename your variable to "qq" in the attached sheet
- You should use range variable in three cases only
for plotting
to index vectors and matrices
in a program when using a for-loop
- The symbolics unfortunateley does not know anything about units and treats them as unknown variables! So it doesn't know that N/pa=m^2 and can't simplify its results. Thats also the reason why its necessary to add the variable x.1 in the "coeffs" command to tell the symbolics which variable it should look at. The symbolics sees three variables - x.1, N and Pa.
You may use the symbolics to directly solve for zeros of the derivative:The symbolic correctly realizes that Pa=0 would be problematic and N=0 yields the simple solution 0.
So you can tell the symbolic via the "assume" command, that Pa is positive:
If you are only interested in the positive solution, you can tell that the symbolic again using "assume", but you also must tell it that N is positive, too, otherwise it would not be able to decide if a solution is positive, negative or even non-real:
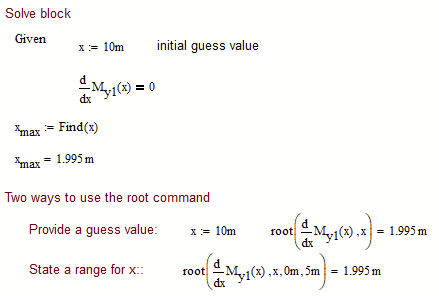
- But you don't have to use the symbolics at all. Mathcad provides numerical means for solving equation with the solve block and the root command
- Mark as New
- Bookmark
- Subscribe
- Mute
- Subscribe to RSS Feed
- Permalink
- Notify Moderator
Hello,
first of all thank you for the help. But for the function q(x.1) i created it to set/create the bending moment function My(x.1) for the first part of l.1. Because if i cut through a certain length x1 there is not q=4kN/m at the peek of the triangular. Its (q/l.1)*x1 for the function.
And i saw you used simply "x" for the bending function. But how do i show the bending moment with the appropriate units for the diagram? Do i have to use 2 functions? 1 for solving the value of the maximum value and 1 for the illustration on the diagram.
And what i am also curious which you used to is how to create this type of symbolic solution that the arrow is in the center? How i am able to to that because in my case it is always at the top argument like the picture provided
Because i wanted to try i myself to use more than one argument but it always puts the symbolic arrow on the top argument. Can you explain or help me how you did that like in the screenshots i attached? Would be appreciated.
I also receive like in the picture above an incomprehensible syntax error all the time and i do not know why. In the picture above, i havent defined any values but for illustrative reasons. Is there any way, that Mathcad solves or symbolically shows the function of the transverse force Qz(x)? Not only for the evaluation of the "x" values but also directly the function like Qz(x)=...x^2+..x
- Mark as New
- Bookmark
- Subscribe
- Mute
- Subscribe to RSS Feed
- Permalink
- Notify Moderator
Let me start by saying that I have little technical understanding of what this worksheet is about. I therefore limit myself to dealing with the handling and usage of Mathcad.
And i saw you used simply "x" for the bending function. But how do i show the bending moment with the appropriate units for the diagram?
I understand that you want to define a piecewise defined function. Range variables are OK for plotting that kind of thing, but not for calculations.
When you define a function, the name of the formal argument does not matter at all!
and is does not matter at all, if and how x or dummy are already defined in the worksheet. This only matters when you evaluate the function using the variable as actual/current argument.
To create a piecewise defined function you can use either the if command (similar in syntax to the "if" available in spreadsheets) or the if-statement from the programming palette.
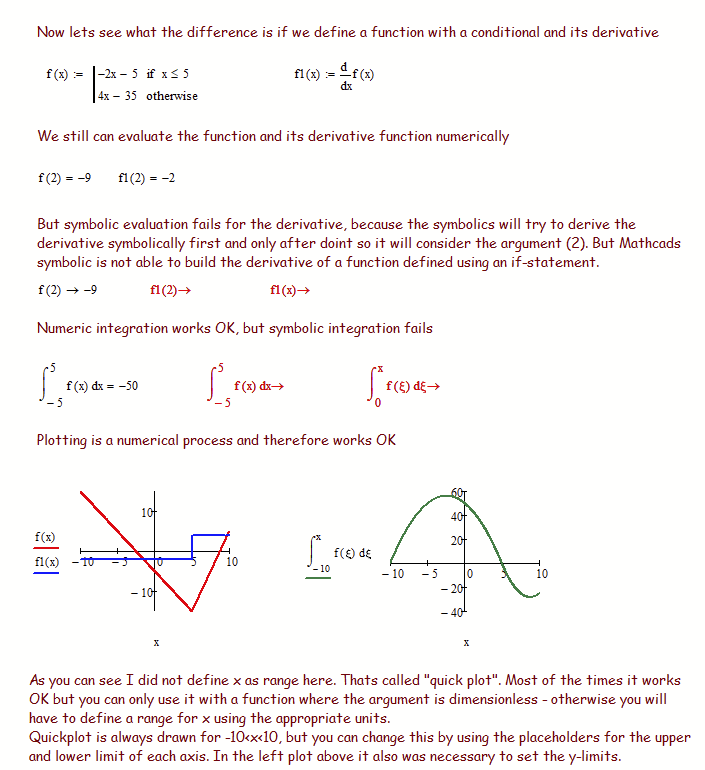
The drawback is that the symbolic often has its problems with functions using if-branches, because they cannot be evaluated symbolically without knowing the specific values for the variables used.
But as I see it you don't need symbolic calculations at all. A numeric solve block or the numeric root command seems to be all thats needed to get your maximum.
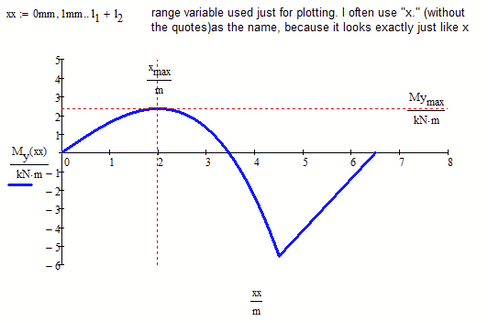
To indicate the units in the plot, you can divide the variable and function by the appropriate unit (use a range variable for plotting when you do so). I assume meter for x and kN*m for M.y:
And what i am also curious which you used to is how to create this type of symbolic solution that the arrow is in the center? How i am able to to that because in my case it is always at the top argument like the picture provided
Because i wanted to try i myself to use more than one argument but it always puts the symbolic arrow on the top argument. Can you explain or help me how you did that like in the screenshots i attached? Would be appreciated.
Actually I have no idea how you created that symbolic evaluation which is shown in your picture. The vertical bar looks like you had created a program, which would be wrong and may be the reason for the error you get.
You create the symbolic eval with keywords either from the symbolic toolbar menu or using the appropriate keyboard shortcut. In foreign (= non-english) languages the tooltip may be wrong. In my German version its says "Ctrl+>" while actually its "Ctrl+:" for a German keyboard:
To add separate different keywords in a row by separating them with a comma and you can add additional lines by simply using the same keyboard short again (or click the toolbar menu item).
Is there any way, that Mathcad solves or symbolically shows the function of the transverse force Qz(x)? Not only for the evaluation of the "x" values but also directly the function like Qz(x)=...x^2+..x
You did it yourself in the sheet! Simply evaluate the function using a formal argument which is still undefined.
You may limit the number of valid digits using the "float" command.
Be careful with the use of "float" when you make actual symbolic calculations because it not only limits the digits for the display but also limits the precision of the whole calculation.
Unfortunately, as already indicated above, you won't be happy with the result if you use a function which is derived from one using branches (if). You might get errors like "this value must be a scalar" or a cryptic "pattern match exception".
I guess that there is no way to symbolically show a function which uses if-statements. There are workarounds by defining the function using boolean expressions or the Heaviside function Phi instead of the if commands, but the results looks quite unclear and clumsy.
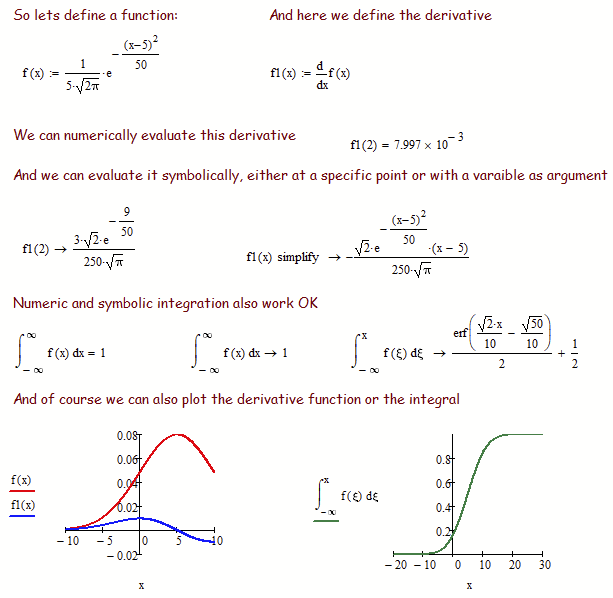
But if the function does not use any "if's" like the test function f you defined at the ned of the worksheet, the symbolic will be happy to display it using any formal argument you provide:
- Mark as New
- Bookmark
- Subscribe
- Mute
- Subscribe to RSS Feed
- Permalink
- Notify Moderator
Hello again,
first of all again appreciate your response. And you speak german as well? Because i searched severall communitys through for help and saw myself this non german communityy/forum as my final solution to ask for help.
Again, a few issues and questions for myself are still open regarding your latest response for my task.
The first one and simple one is the command option. In the Screenshot you showed me the matching symbol. I already used that but it always centers the arrow at the top argument like in the screenshot of my latest response. How do i need to enter the commands to work correctly? I used the symbolic like in your screenshot.
I typed the variable and after that i pressed the toolbar symbol as in the picture.
The second question would be related to the function itself. In your edited sheet, you calculated the zero values of the bending moment and therefore the maximum points by simply using the derivation of My1(x) but how does Mathcad know, that x has to be in "m" or a length as the result. From the logical point as engineer or tech person it has to be clear because of the existing units.But you havent defined "x" whether as a range variable or any kind of variable? Is "x" just an variable you can use all the time for calculations and derivations and stuff like that? That's clear for me but only curious about the units. So it only matters when i want to calculate some values etc how the function is defined right?
I understand that you want to define a piecewise defined function. Range variables are OK for plotting that kind of thing, but not for calculations.
When you define a function, the name of the formal argument does not matter at all!
and is does not matter at all, if and how x or dummy are already defined in the worksheet. This only matters when you evaluate the function using the variable as actual/current argument.
The drawback is that the symbolic often has its problems with functions using if-branches, because they cannot be evaluated symbolically without knowing the specific values for the variables used.
But as I see it you don't need symbolic calculations at all. A numeric solve block or the numeric root command seems to be all thats needed to get your maximum.
You may limit the number of valid digits using the "float" command.
Be careful with the use of "float" when you make actual symbolic calculations because it not only limits the digits for the display but also limits the precision of the whole calculation.
But can i use now this derivitation only for calculation or also to illustrate it in the diagram? Or do i have to define it again? While it is only Q.z1(x) but i have to define it for a range right?
My last point is just me beeing curious about your latest diagram attached in the file with the peek points. How do i highlight them with the cross?
But i appreciate already your kind support and help regarding my issue. Today i learned quite alot about Mathcad even though i used it quite a lot during my technical education time in school the last few years.
- Mark as New
- Bookmark
- Subscribe
- Mute
- Subscribe to RSS Feed
- Permalink
- Notify Moderator
Yes, I as an Austrian I am German speaking 😉
I also don't know of a german Forum where yo could get help about the usage of Mathcad. The only German forums with a separate Mathcad subforum I am aware of are Cad.de (where you already posted as I saw) and Matheraum.de. But both are more dead than alive.
I can't understand your problem with the position of the arrow in symbolic evaluations. It sure should be centred if you use "Strg-Shift-." or the menu for every new line of commands. You may post a small demo sheet along with a screen shot how it looks at your side. So we can open it and we'll see how it looks at our side.
You ask how Mathcad knows about the correct unit of the variable x. Mathcad can deal with units and if you set up your equations unit balanced, then solving will automatically result in a correct unit. For dimension length you always get metre (if SI-system is set) and you may change the output unit by using the placeholder after the unit.
Try to evaluate My(3m) = and you will get a correct result. Try to evaluate with My(3 m^2) and you will get an error. The way the function is set up the argument must be a length and mathcad considered that.
When you define the derivative of a function you may use it for plotting, for numeric evaluation and also for symbolic. But If it contains some sort of "if", the sybolics will choke on it.
To get the horizontal and vertical markers you need to double click the plot and check "Show Markers" on both axis. This gives you two placeholders for each axis where you can put the values where to plot the marker lines. Unfortunately we are limited to just two marker per axis.
- Mark as New
- Bookmark
- Subscribe
- Mute
- Subscribe to RSS Feed
- Permalink
- Notify Moderator
Hello again,
i am also from Austria and you'r right, it is hard to find a community, prefered in german to get some help. As you said, i already posted it on cad.de but the last post was made 1 1/2 months ago related to Mathcad. So i am not that patient if the internet couldnt help me that good as you did.
So i am very happy and appreciate your patience and also explanation for my listed problems.
For the first problem i asked, i already solved it but unfortunately posted it again related to your solution with "centred arrow by using "Strg-Shift-." I didnt press it a second time to see the centered arrow.
For the Unit problem. I already had a suspicion in terms of that Mathcad kinda knows how to deal with the missing unit.
"When you define the derivative of a function you may use it for plotting, for numeric evaluation and also for symbolic. But If it contains some sort of "if", the sybolics will choke on it."
what do you mean exactly with that? What is also plotting? i heard it several times but never used or i assume.
But i want to ask you hopefully the last time, i only should use the definition with only "x" and not a range variable for calculating of maxima or zero points is that right? I just want to determine this for my future tasks?
But when i do want to show things on graphs (diagram of the Mby-Moment), i have to define a range variable otherwise the units wont match if only x is dimensionless right?
But overall thank you again for your help.
- Mark as New
- Bookmark
- Subscribe
- Mute
- Subscribe to RSS Feed
- Permalink
- Notify Moderator
For the first problem i asked, i already solved it but unfortunately posted it again related to your solution with "centred arrow by using "Strg-Shift-." I didnt press it a second time to see the centered arrow.
I already suspected that you created a new program line instead of pressing Strg-Shift-. a second time
"When you define the derivative of a function you may use it for plotting, for numeric evaluation and also for symbolic. But If it contains some sort of "if", the sybolics will choke on it."
what do you mean exactly with that? What is also plotting? i heard it several times but never used or i assume.
Plotting means drawing the graph of the function.
Concerning the other question, some examples:
But i want to ask you hopefully the last time, i only should use the definition with only "x" and not a range variable for calculating of maxima or zero points is that right? I just want to determine this for my future tasks?
But when i do want to show things on graphs (diagram of the Mby-Moment), i have to define a range variable otherwise the units wont match if only x is dimensionless right?
When you define a function like f(x):=...any expression in x then x must not defined in any way. All that counts is that the name in the parenthesis on the left side is the same you use on the right side. Any definition of x you made would be ignored anyway. Then you can use this function for whatever analytic calculations you have in mind (with the exception of symbolic manipulations if it contains conditionals as explained above).
For plotting you can use a range and you must use a range if the abscissa values should have any units.
- Mark as New
- Bookmark
- Subscribe
- Mute
- Subscribe to RSS Feed
- Permalink
- Notify Moderator
Hello again,
thank you for your help and detailed explanation. I have to calmly reread your whole explanation etc again but i do want to ask, because you kinda explained it already whether it is possible to define a rang for a function without defining x itself.
All this is regarding the visualisation for the graph.
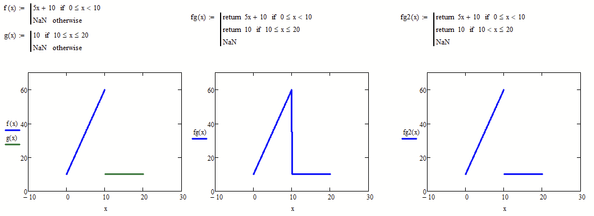
Lets say i have two functions f(x)= 5x+10 and g(x)=5. The first and second graph should meet each other. Do not see this numbers as detailed reference i just used it for explanation.
The first graph f(x) should be visible from e.g 0 to 10 and the second one from 10 to 20.
Do i have to define each function there own range variable like x1 and x2 or can i do it with this plotting or a solution similiar to this?
Because i dont want to use "x" in both functions without saying f(x1)=... and g(x2)=...
Would appreciate your help again.
Its not directly related to the task but i did have the issue several times for mathematical task with splitted and combined functions over a "total" range.
Thank you!
be in a range
- Mark as New
- Bookmark
- Subscribe
- Mute
- Subscribe to RSS Feed
- Permalink
- Notify Moderator
- Mark as New
- Bookmark
- Subscribe
- Mute
- Subscribe to RSS Feed
- Permalink
- Notify Moderator
I wouldn't bother with ranges but rather define the functions using if statements or the if function, as Fred had shown.
If your goal is mainly plotting, you might also consider defining just one piecewise function piecewise and not two. The difference may be a (vertical) line connect the parts which you also can deal with (see "fg2", for which fg2(10)=NaN .. Not-A-Number).
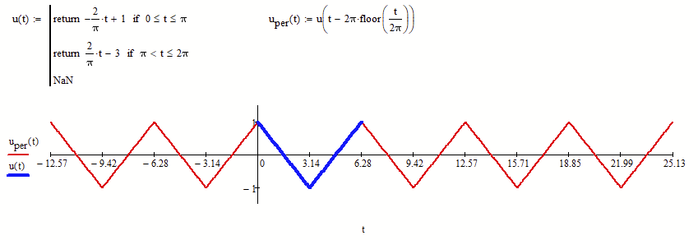
You may also define periodic functions quite easy
- Mark as New
- Bookmark
- Subscribe
- Mute
- Subscribe to RSS Feed
- Permalink
- Notify Moderator
Since I used to do this for a living and I'm stuck at home from the virus, I took a shot at this (using Prime 4.0 Express.) I don't like your graph of moment!
I don't think you can get a reversal like that with this loading.
Mine looks much different.
Attached is Prime 4.0 sheet (and pdf.)
- Mark as New
- Bookmark
- Subscribe
- Mute
- Subscribe to RSS Feed
- Permalink
- Notify Moderator
The graph of the bending moment attached in my file is correct. I checked i with the given solution option from the book.
And secondly it goes to zero with a linear function and function third grad due the triangular track load.
- Mark as New
- Bookmark
- Subscribe
- Mute
- Subscribe to RSS Feed
- Permalink
- Notify Moderator
Could be I miss-understood the problem.
I thought you had a beam, simply supported both ends, partial length distributed load (q), and load F1 at the right end at a 60 degree angle, putting a vertical load and a cross load (into/out of the page).
In that case ALL of F1 gets reacted in the right support.
If I got it wrong, I apologize!
- Mark as New
- Bookmark
- Subscribe
- Mute
- Subscribe to RSS Feed
- Permalink
- Notify Moderator
After I "reverse engineered" your file (triangular extrapolation), I was able to develop basically the same analysis. (triangular load line 3.)
One question: What is the purpose of the 60°?
- Mark as New
- Bookmark
- Subscribe
- Mute
- Subscribe to RSS Feed
- Permalink
- Notify Moderator
Pushing a few steps further, you can calculate (very inaccurately) beam deflection. Prime 4.0 attached.
EDIT: Revised sheet attached!
- Mark as New
- Bookmark
- Subscribe
- Mute
- Subscribe to RSS Feed
- Permalink
- Notify Moderator
Thank you also for sharing your thoughts and opinion.
A bit late but i attached the original task i used to work around with MC.
But appreciate you concerns and help.
- Mark as New
- Bookmark
- Subscribe
- Mute
- Subscribe to RSS Feed
- Permalink
- Notify Moderator
One last gasp. The effects of the canted end load:
I pushed the analysis further than was intended. To do that I had to assume things not specified:
- A material (to specify Young's Modulus)
- A section inertia
Then we can compute slopes and deflections. And then the canted load (combined with the deflection) causes another bending moment, which would change the deflection.
More than you were asked to do.


