
Turn on suggestions
Auto-suggest helps you quickly narrow down your search results by suggesting possible matches as you type.
Showing results for
Please log in to access translation
Turn on suggestions
Auto-suggest helps you quickly narrow down your search results by suggesting possible matches as you type.
Showing results for
Community Tip - When posting, your subject should be specific and summarize your question. Here are some additional tips on asking a great question. X
Translate the entire conversation x
Please log in to access translation
Options
- Subscribe to RSS Feed
- Mark Topic as New
- Mark Topic as Read
- Float this Topic for Current User
- Bookmark
- Subscribe
- Mute
- Printer Friendly Page
Differential Models
Aug 16, 2013
08:44 AM
- Mark as New
- Bookmark
- Subscribe
- Mute
- Subscribe to RSS Feed
- Permalink
- Notify Moderator
Please log in to access translation
Aug 16, 2013
08:44 AM
Differential Models
Good morning,
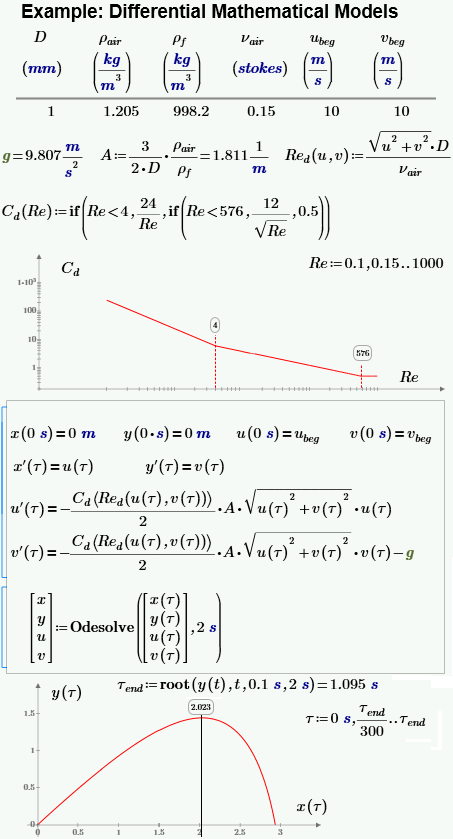
I am reading an excellent book regarding differential models: "Differential Models: An Introduction with MathCad" (english version, by Alexander Solodov and Valery Ochkov). Even if I have been working with MathCad for several years and I have developped a good undesrtanding of programing and other software capabilities, I have no experience with differential models and that's why I start practicing with all the examples I found in this book.
The question: I having some troubles with one of the examples, the movement of water drop in air by gravity and resistance force. I tried to follow, step by step, all the calculation shown in the book, but for some reason I didn't get the same answer. I would appreciate if someone can take a look at it an point me out what I am doing wrong.
I am including whit the worksheet a few images of the example, so you can compare the original information provided.
Thanks a lot,
Lij.
Solved! Go to Solution.
ACCEPTED SOLUTION
Accepted Solutions
Aug 16, 2013
09:23 AM
- Mark as New
- Bookmark
- Subscribe
- Mute
- Subscribe to RSS Feed
- Permalink
- Notify Moderator
Please log in to access translation
Aug 16, 2013
09:23 AM
You had setup the range variable for tau with 0.01 .. tau.end+0.1
That way you have a (far too large) step width of 1 - in fact you just graph two points and thats why you get a straight line. In the book you misinterpreted the comma as dot and overlooked the dot.
The correct range for tau given in the book is 0, 0.1 .. tau.end+0.1 (a step width of 0.1)
P.S.: I don't know the book but I wonder if the publisher doesn't offer a download link for all the files used in the book. At least thats quite common nowadays and would make sense.
One author of the book, Valery Ochkov, is around here in this forum. Maybe he can help you avoiding to retype all the sheets. On the other hand, learning effect may be better if the sheet has to be retyped, though 😉
4 REPLIES 4
Aug 16, 2013
09:23 AM
- Mark as New
- Bookmark
- Subscribe
- Mute
- Subscribe to RSS Feed
- Permalink
- Notify Moderator
Please log in to access translation
Aug 16, 2013
09:23 AM
You had setup the range variable for tau with 0.01 .. tau.end+0.1
That way you have a (far too large) step width of 1 - in fact you just graph two points and thats why you get a straight line. In the book you misinterpreted the comma as dot and overlooked the dot.
The correct range for tau given in the book is 0, 0.1 .. tau.end+0.1 (a step width of 0.1)
P.S.: I don't know the book but I wonder if the publisher doesn't offer a download link for all the files used in the book. At least thats quite common nowadays and would make sense.
One author of the book, Valery Ochkov, is around here in this forum. Maybe he can help you avoiding to retype all the sheets. On the other hand, learning effect may be better if the sheet has to be retyped, though 😉
Aug 16, 2013
03:34 PM
- Mark as New
- Bookmark
- Subscribe
- Mute
- Subscribe to RSS Feed
- Permalink
- Notify Moderator
Please log in to access translation
Aug 16, 2013
03:34 PM
Thanks for the interesting on the book.
You can download worksheets of the book here http://twt.mpei.ac.ru/ochkov/work2_eng.htm
And welcome to others models with animation:
http://communities.ptc.com/groups/dynamic-models-in-mathcad
Alexander and me have a plan to publish a new version of the book based on Mathcad Prime.
Aug 17, 2013
02:48 AM
- Mark as New
- Bookmark
- Subscribe
- Mute
- Subscribe to RSS Feed
- Permalink
- Notify Moderator
Please log in to access translation
Aug 17, 2013
02:48 AM
Alexander and me have a plan to publish a new version of the book based on Mathcad Prime.
We can work with units in Prime:
Aug 19, 2013
08:08 AM
- Mark as New
- Bookmark
- Subscribe
- Mute
- Subscribe to RSS Feed
- Permalink
- Notify Moderator
Please log in to access translation
Aug 19, 2013
08:08 AM
Good morning,
Thank you Valery and Werner for your reply. Very helpful.
Regards,
Oscar J.


