- Subscribe to RSS Feed
- Mark Topic as New
- Mark Topic as Read
- Float this Topic for Current User
- Bookmark
- Subscribe
- Mute
- Printer Friendly Page
Discrepancy in Bode Plot: Phase - Frequency Plot -> Mathcad vs Matlab
- Mark as New
- Bookmark
- Subscribe
- Mute
- Subscribe to RSS Feed
- Permalink
- Notify Moderator
Discrepancy in Bode Plot: Phase - Frequency Plot -> Mathcad vs Matlab
Hello Dear Friends,
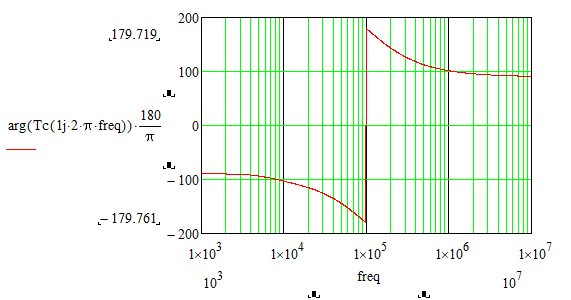
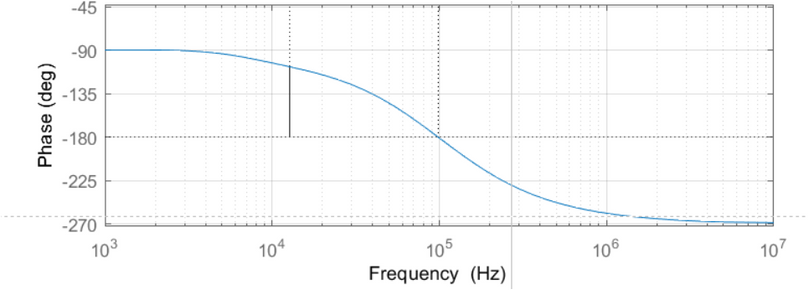
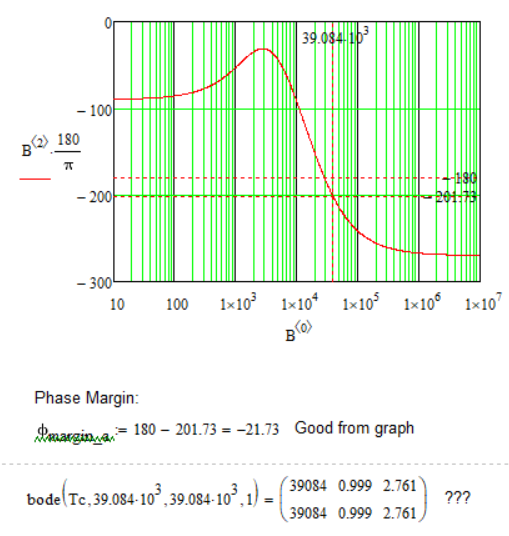
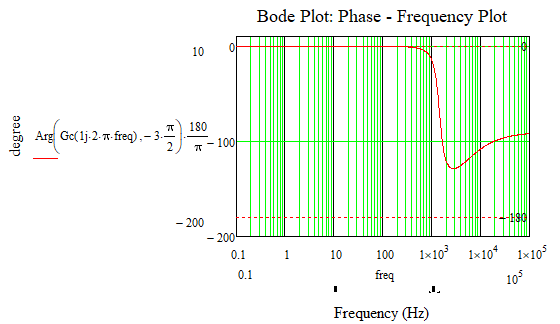
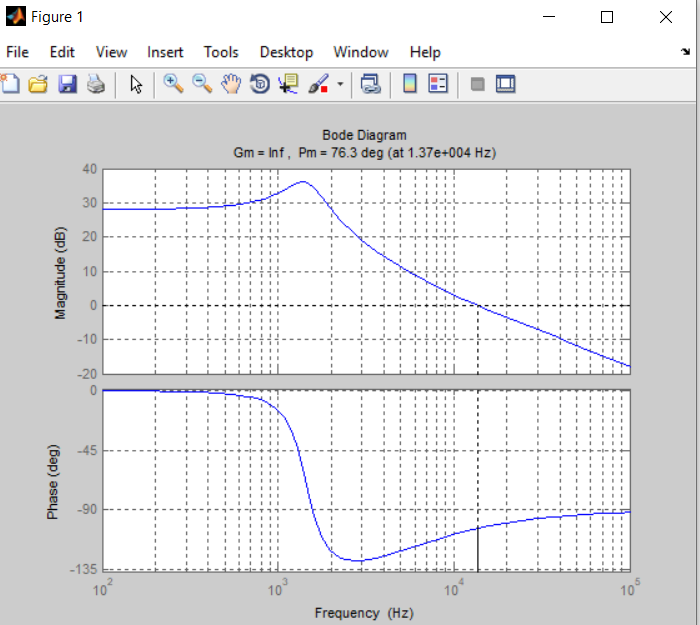
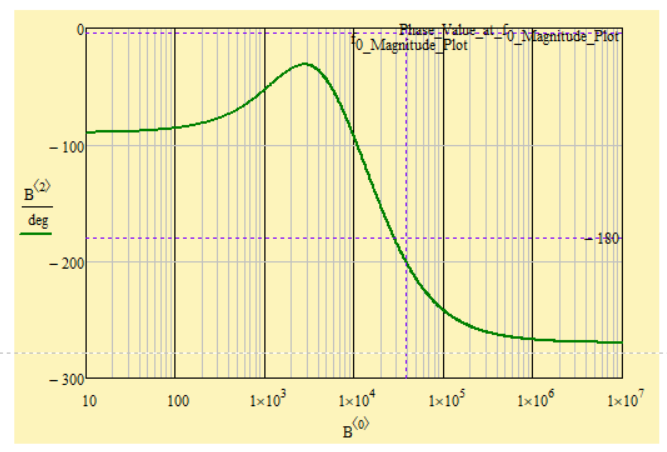
How can it be solved that the phase - frequency graph of the bode diagram in Mathcad looks like the phase - frequency graph of the bode diagram in Matlab?
Calculations and graphs were made in Mathcad 15.
Attached is the Mathcad 15 file with the details.
Thank you.
Best regards.
Solved! Go to Solution.
- Labels:
-
Electrical_Engineering
-
Mathcad Usage
Accepted Solutions
- Mark as New
- Bookmark
- Subscribe
- Mute
- Subscribe to RSS Feed
- Permalink
- Notify Moderator
Matlab's bode somehow finds a way to examine the transfer function and so to determine the best range the phase should be placed at.
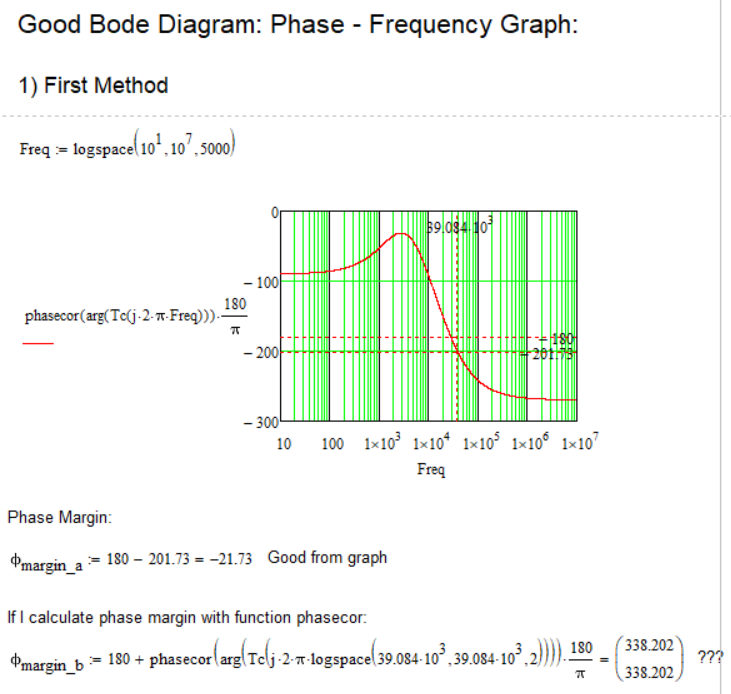
Mathcads arg function doesn't know anything about the transfer function - its simply receives a complex number and returns its argument, the angle, and this will always be in the range (-pi; +pi]. This range is as good as any other and its similar to the atan2 function. And thats also the reason you get the jump up to +180° step when the angle would go below -180°. "arg" would never give you an angle below (or equal to) -180°.
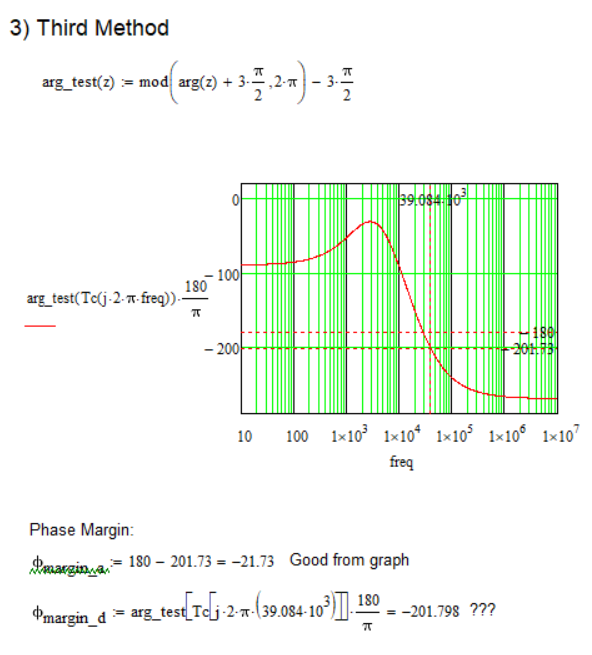
Easiest solution is to write an alternative "arg" function which returns the angle in a different 2 pi interval.
Put it at the top of the sheet (maybe in a collapsed region).
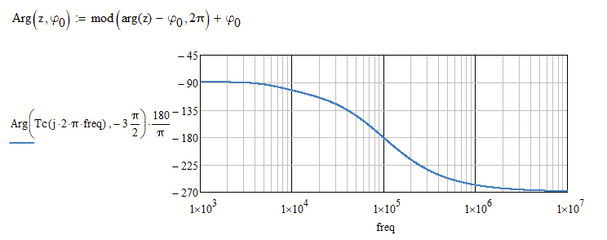
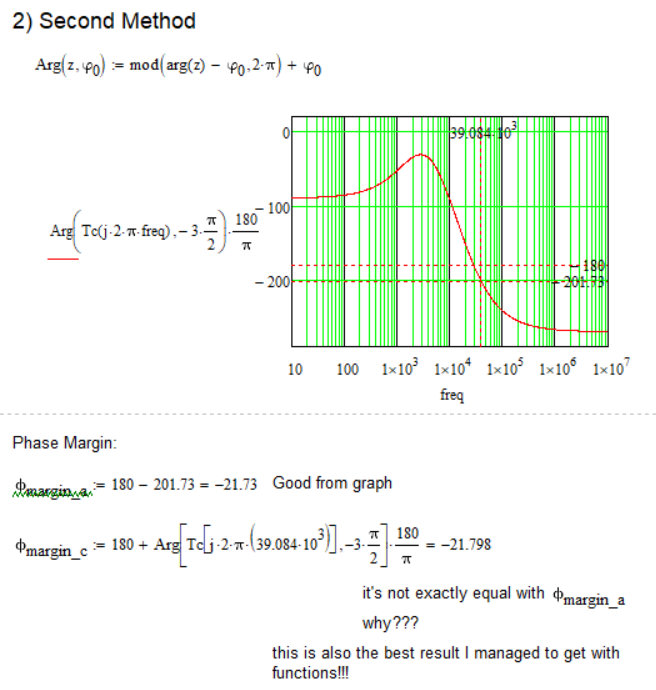
Or you may use an all-purpose "Arg" function where you can choose the start of the 2pi interval as its second argument:
The drawback of these simple solutions are, that you have to determine and chose the range for the angle manually yourself and that they only work OK as long as the range of angle values does not exceed a 2 pi interval.
- Mark as New
- Bookmark
- Subscribe
- Mute
- Subscribe to RSS Feed
- Permalink
- Notify Moderator
Ok.
Thank you very much for your response (for both comments/answers/suggestions).
Thank you.
Best regards.
- Mark as New
- Bookmark
- Subscribe
- Mute
- Subscribe to RSS Feed
- Permalink
- Notify Moderator
I just noticed that most of what i said above was already covered in a thread of yours with a similar question
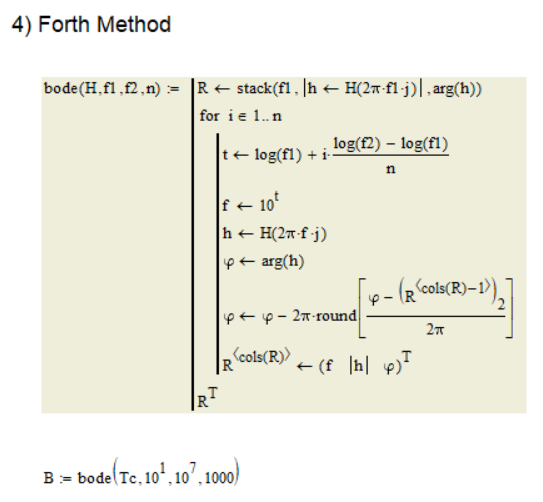
In this detailed discussion I provided a "bode" function which you could have used - why didn't you?
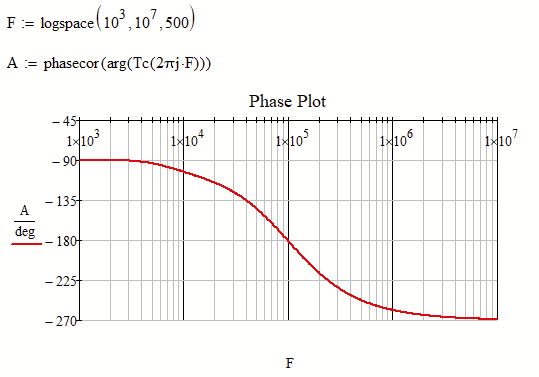
Furthermore later in the very same discussion the "phasecor" function was brought to my/our attention and it could also help with the problem of discontinuities in bode plots:
- Mark as New
- Bookmark
- Subscribe
- Mute
- Subscribe to RSS Feed
- Permalink
- Notify Moderator
- Tags:
- Prime_6.0
- Mark as New
- Bookmark
- Subscribe
- Mute
- Subscribe to RSS Feed
- Permalink
- Notify Moderator
@Werner_E , @Fred_Kohlhepp , @LucMeekes , @ValeryOchkov
Is there any way to result in the corresponding value of the phase margin as shown in the graph, but using the above functions (or others, is not a problem), and not looking at the graph and reading from it???
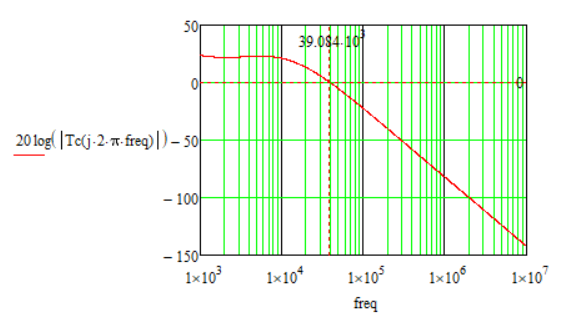
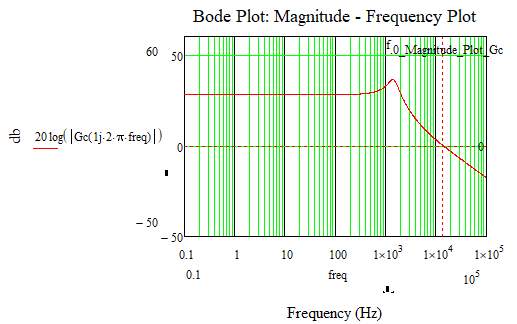
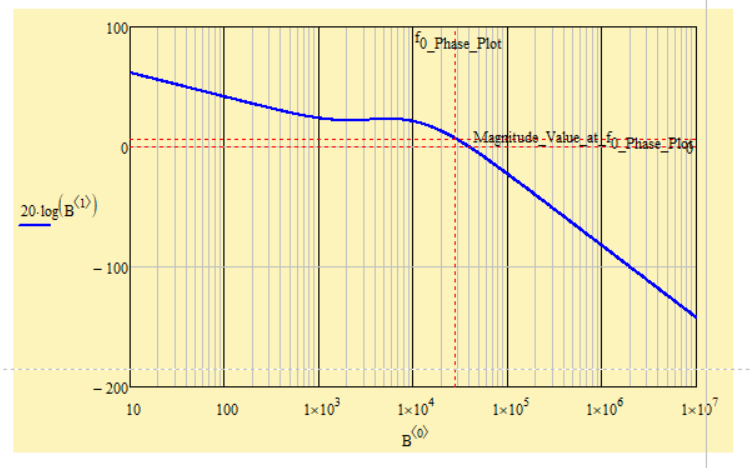
Bode Diagram: Magnitude - Frequency Plot:
Calculations and graphs were made in Mathcad 15.
Attached is the Mathcad 15 file with the details.
Thank you.
Best regards.
- Mark as New
- Bookmark
- Subscribe
- Mute
- Subscribe to RSS Feed
- Permalink
- Notify Moderator
Did you notice that you can also plot the magnitude using the results of "bode". You may consider modifying "bode" to do the log and times 20 itself.
I can image that you are looking for something like this:
- Mark as New
- Bookmark
- Subscribe
- Mute
- Subscribe to RSS Feed
- Permalink
- Notify Moderator
Not able to edit my previous post.
Here is the MC15 file attached.
I also added a function to do the job - may come handy.
I wasn't sure about the adding of 180° which you did, so I did without it. You may add it in the function if thats more appropriate.
- Mark as New
- Bookmark
- Subscribe
- Mute
- Subscribe to RSS Feed
- Permalink
- Notify Moderator
"I wasn't sure about the adding of 180° which you did, so I did without it. You may add it in the function if thats more appropriate."
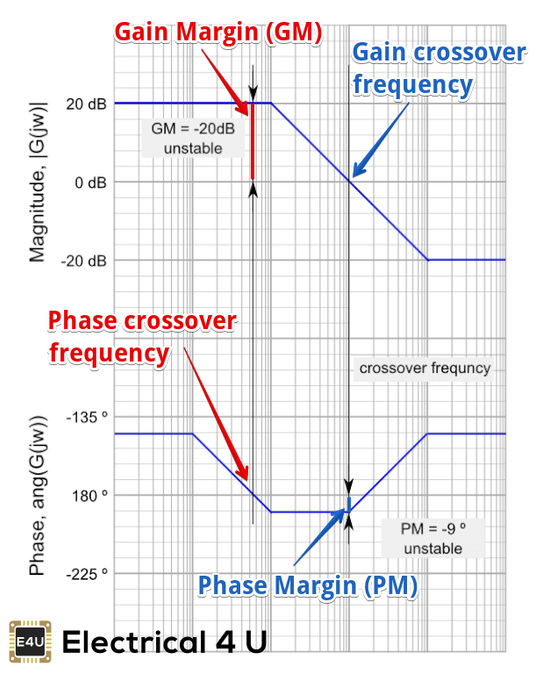
Is used in control engineering for system stability.
You can read more in this article:
https://www.electrical4u.com/bode-plot-gain-margin-phase-margin/
Phase Margin Formula:
The formula for Phase Margin (PM) can be expressed as:
Where is the phase lag (a number less than 0). This is the phase as read from the vertical axis of the phase plot at the gain crossover frequency.
- Mark as New
- Bookmark
- Subscribe
- Mute
- Subscribe to RSS Feed
- Permalink
- Notify Moderator
So I guess you should add the 180° already in the function, in case you decide to use it.
- Mark as New
- Bookmark
- Subscribe
- Mute
- Subscribe to RSS Feed
- Permalink
- Notify Moderator
Ok.
If I encounter any more "adventures" in the future I will post.
Until then... thanks for suggestions, answers, and time.
Thank you.
Best regards.
- Mark as New
- Bookmark
- Subscribe
- Mute
- Subscribe to RSS Feed
- Permalink
- Notify Moderator
@Werner_E
First of all, thank you for your support in creating those functions, your time, and your suggestions.
I came up with a new idea/challenge (as I said in the previous message, I'm coming back :))) to which I still can't find an answer/solution.
Maybe you have a solution/idea.
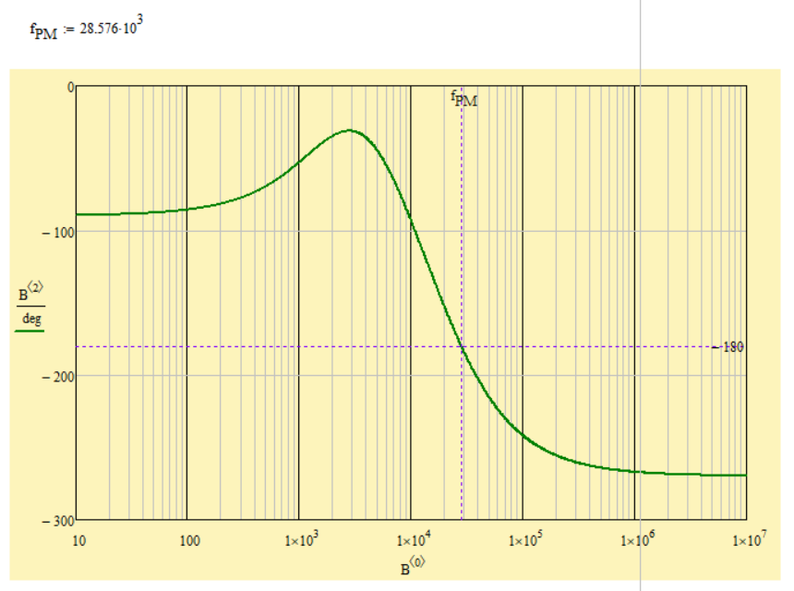
I would like to find out using a function, something, from the bode diagram of the phase - frequency graph, the frequency at which the graph cuts the value of -180 degrees, and not looking at the graph and reading from it.
I can't find the right option/variant.
Could you take a look?
Than you.
Best regards.
- Mark as New
- Bookmark
- Subscribe
- Mute
- Subscribe to RSS Feed
- Permalink
- Notify Moderator
And then to find gain margin (GM) as in the chart above, from a previous comment.
This is the final idea I want to reach, to find an answer.
- Mark as New
- Bookmark
- Subscribe
- Mute
- Subscribe to RSS Feed
- Permalink
- Notify Moderator
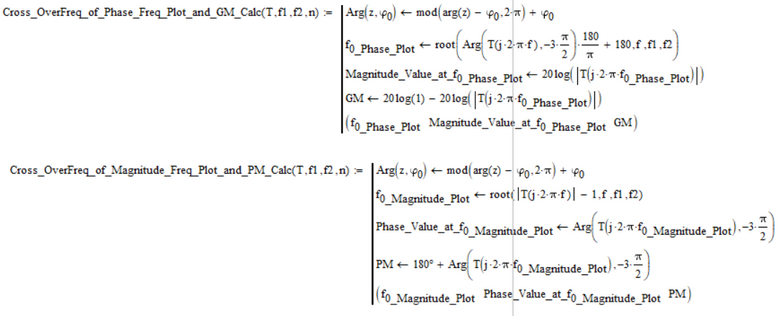
To find the phase crossover, how about:
Instead of finding the phase 180°, turn the phase function and search for 0°.
And of course, to find the 0 dB in the gain, search for gain=1:
Success!
Luc
- Tags:
- o find the
- Mark as New
- Bookmark
- Subscribe
- Mute
- Subscribe to RSS Feed
- Permalink
- Notify Moderator
Thank you.
- Mark as New
- Bookmark
- Subscribe
- Mute
- Subscribe to RSS Feed
- Permalink
- Notify Moderator
So your margins can be easily calculated, without a phase correction function:
(Note: this was on the function:
with
)
Success!
Luc
- Mark as New
- Bookmark
- Subscribe
- Mute
- Subscribe to RSS Feed
- Permalink
- Notify Moderator
Of course this must be corrected (function parameter is H, not Tc, so function should use H, not Tc):
Sorry for any inconvenience caused.
Luc
- Mark as New
- Bookmark
- Subscribe
- Mute
- Subscribe to RSS Feed
- Permalink
- Notify Moderator
@Werner_E, @LucMeekes, @Fred_Kohlhepp, @ttokoro, @-MFra-
As far as I know, so far, I think the next option seems to be good (inspired by @LucMeekes suggestion:))):
For testing let's take the following example:
The Plant Transfer Function is:
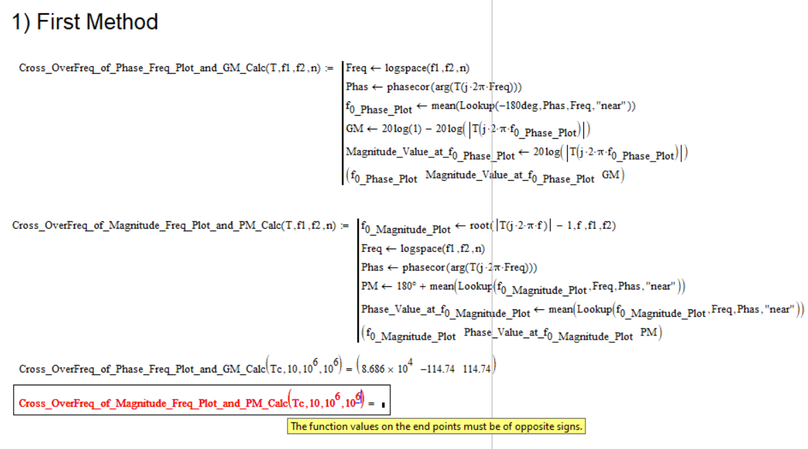
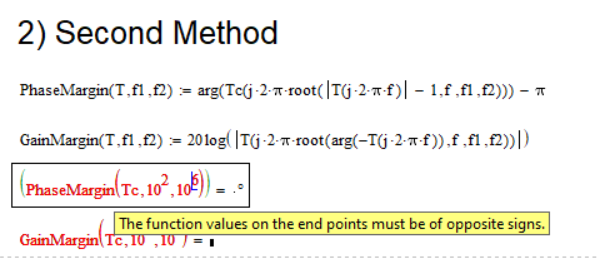
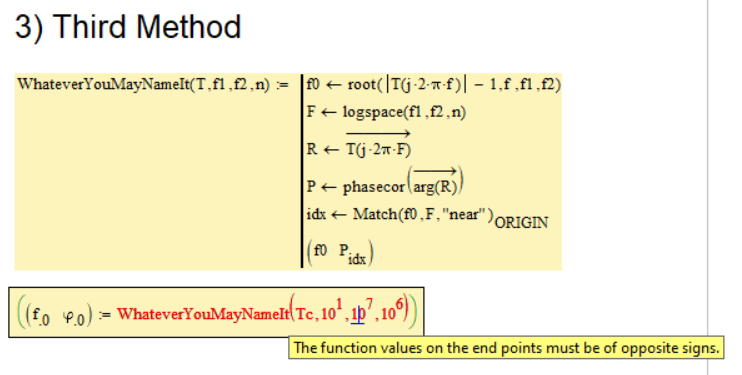
The fact that the function does not return a value for:
is due to the fact that in the phase-frequency graph from the bode characteristic, this graph does not cut the -180 degree axis, which translates into:
Which sounds good, that is, okay with what it looks like on the graphs.
Now if you have any idea if it can be realized that when the phase-frequency characteristic from the bode diagram does not cut the -180 degree axis, that the three values directly return infinite values, and not be red as shown above?
Even so, if you can't, it's fine, very good because I know what that means now. :))
Matlab verification:
Thank you.
Best regards.
- Mark as New
- Bookmark
- Subscribe
- Mute
- Subscribe to RSS Feed
- Permalink
- Notify Moderator
Hmmm ...
- Mark as New
- Bookmark
- Subscribe
- Mute
- Subscribe to RSS Feed
- Permalink
- Notify Moderator
- Mark as New
- Bookmark
- Subscribe
- Mute
- Subscribe to RSS Feed
- Permalink
- Notify Moderator
I can't open the Mathcad file (Prime 4).
Can you put a picture, something?
- Mark as New
- Bookmark
- Subscribe
- Mute
- Subscribe to RSS Feed
- Permalink
- Notify Moderator
- Mark as New
- Bookmark
- Subscribe
- Mute
- Subscribe to RSS Feed
- Permalink
- Notify Moderator
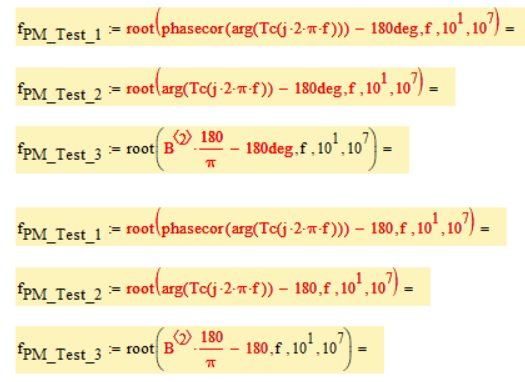
Test_1: "phasecor" can only be applied to vector arguments, not functions. So Test_1 has to fail
Test_3: "root" will only work on continuous functions, not on vectors like B<2>
Test_2: "root" will only work on continuous functions. Unfortunately arg(...) has a discontinuity, a jump, at +/- pi and so the function has to fail.
You may use a modified arg-function as described elsewhere in this thread which creates a continuous function at -180°. Using this function your Test_2 approach may work. The drawback is that using a modified arg-function requires you to decide on how to modify the arg function dependent on the specific transfer function and the range of angles you'd like to see.
But you could use the second "flavor" of the root function, where you don't have to provide a range (10^1 to 10^7 in your example) but a reasonable guess value:
Note that root finds the zeros of a function and to solve the equation f(x)=-180 you have to look for the zeros of the function f(x)+180
Another way I could think of is to do it similarly as I had shown it for the frequency where the magnitude equals 1. That means creating a large vector of frequency values and corresponding phase values which are "corrected" using phasecor. Then look in the phase vector for a phase near -180!
- Mark as New
- Bookmark
- Subscribe
- Mute
- Subscribe to RSS Feed
- Permalink
- Notify Moderator
That turned out well.
Excellent.
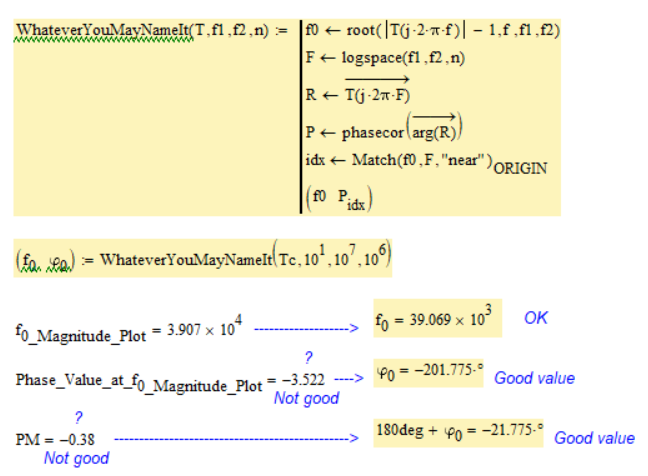
Now I'm struggling with this function because I'm trying to do code-like with the function above.
It doesn't go well :((.
Why?
What am I wrong or omitted?
- Mark as New
- Bookmark
- Subscribe
- Mute
- Subscribe to RSS Feed
- Permalink
- Notify Moderator
Why?
What am I wrong or omitted?
??? The values you mark as "Not good" seem to be the same as the ones you mark as "Good value", just shown in radiant and not in degrees.
- Mark as New
- Bookmark
- Subscribe
- Mute
- Subscribe to RSS Feed
- Permalink
- Notify Moderator
Good!
I found a special case for a system (or rather, for several systems, as if its power increases, for example: s ^ 2, s ^ 3, etc.), I receive the same message.
How could this be remedied?
Thank you.
Best regards.
- Mark as New
- Bookmark
- Subscribe
- Mute
- Subscribe to RSS Feed
- Permalink
- Notify Moderator
> How could this be remedied?
I don't known
maybe there is no way to deal automatically with all possibly eventualities in Mathcad, maybe there is and we have not yet found it 😉
- Mark as New
- Bookmark
- Subscribe
- Mute
- Subscribe to RSS Feed
- Permalink
- Notify Moderator
@Werner_E, @Fred_Kohlhepp, @LucMeekes
In any case, I would like to thank you very, very, very much so far for your ideas, suggestions, and for your time and involvement. These suggestions were very useful to me in the turning points.
if in the future you will find new ideas and suggestions about what has been discussed so far here, this is the good topic to post :).
Likewise, if I find any more "doubts"/more "questions", I will post them as well.
Thank you very much.
Best regards.
- Mark as New
- Bookmark
- Subscribe
- Mute
- Subscribe to RSS Feed
- Permalink
- Notify Moderator
With 1/s you have a first-order function. It'll not come near instability.
You may want to use symbolic functions to assess the order of the H function (or of its numerator and denominator) to find if you need to check for instability at all.
Success!
Luc
- Mark as New
- Bookmark
- Subscribe
- Mute
- Subscribe to RSS Feed
- Permalink
- Notify Moderator
If you calculate and plot the gain of 1/s, you get
Since the gain NEVER gets to 0 dB, so there is no root, and you can't find that frequency.

