
Turn on suggestions
Auto-suggest helps you quickly narrow down your search results by suggesting possible matches as you type.
Showing results for
Please log in to access translation
Turn on suggestions
Auto-suggest helps you quickly narrow down your search results by suggesting possible matches as you type.
Showing results for
Community Tip - New to the community? Learn how to post a question and get help from PTC and industry experts! X
Translate the entire conversation x
Please log in to access translation
Options
- Subscribe to RSS Feed
- Mark Topic as New
- Mark Topic as Read
- Float this Topic for Current User
- Bookmark
- Subscribe
- Mute
- Printer Friendly Page
Errors in x-axis
Dec 10, 2013
12:37 PM
- Mark as New
- Bookmark
- Subscribe
- Mute
- Subscribe to RSS Feed
- Permalink
- Notify Moderator
Please log in to access translation
Dec 10, 2013
12:37 PM
Errors in x-axis
Hello,
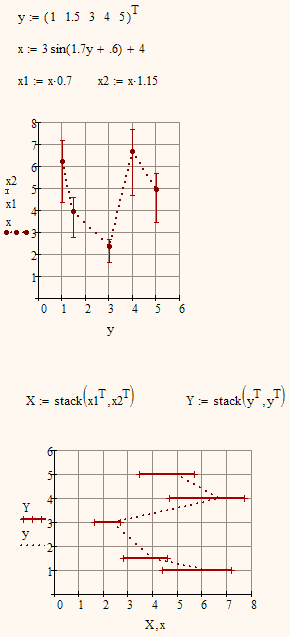
In Mathcad 15, is it possible to add error bars to the x axis of a plot? I have a data series of 10 x values and 10 y values. The error in y is 0 however there are individual errors in each x values and I am wondering if it is possible to add horizontal error bars.
Any help would be appreciated.
Labels:
- Labels:
-
Statistics_Analysis
4 REPLIES 4
Dec 10, 2013
01:25 PM
- Mark as New
- Bookmark
- Subscribe
- Mute
- Subscribe to RSS Feed
- Permalink
- Notify Moderator
Please log in to access translation
Dec 10, 2013
01:25 PM
I am wondering if it is possible to add horizontal error bars.
Not that I am aware of.
Would a transposed plot, plotting x over y instead of y over x be an option?
Dec 10, 2013
01:34 PM
- Mark as New
- Bookmark
- Subscribe
- Mute
- Subscribe to RSS Feed
- Permalink
- Notify Moderator
Please log in to access translation
Dec 10, 2013
01:34 PM
Unfortunately not, it's an x-y phase diagram for adsorbed mole fraction on an adsorbant surface unfortunately. Also as I'm trying to compare the empirical results (data series) with those found using IAST I have had to use a solve block so want to plot that on the same curve, which is why I am wanting to do it on mathcad rather than grace or excel.
Thanks anyway.
Dec 10, 2013
01:53 PM
- Mark as New
- Bookmark
- Subscribe
- Mute
- Subscribe to RSS Feed
- Permalink
- Notify Moderator
Please log in to access translation
Dec 10, 2013
01:53 PM
So you may consider creating your own error plot if the data is in vectors. You will also have the benefit of more control over line thickness.
Dec 10, 2013
08:40 PM
- Mark as New
- Bookmark
- Subscribe
- Mute
- Subscribe to RSS Feed
- Permalink
- Notify Moderator
Please log in to access translation
Dec 10, 2013
08:40 PM
I wrote some functions to do this. I have posted these before, but can't find the thread. See the attached.


