
Turn on suggestions
Auto-suggest helps you quickly narrow down your search results by suggesting possible matches as you type.
Showing results for
Please log in to access translation
Turn on suggestions
Auto-suggest helps you quickly narrow down your search results by suggesting possible matches as you type.
Showing results for
We are aware of an issue causing pages to load incorrectly for some users and expect a fix soon. Sorry for the inconvenience.
Translate the entire conversation x
Please log in to access translation
Options
- Subscribe to RSS Feed
- Mark Topic as New
- Mark Topic as Read
- Float this Topic for Current User
- Bookmark
- Subscribe
- Mute
- Printer Friendly Page
Errors in x-axis
Dec 10, 2013
12:37 PM
- Mark as New
- Bookmark
- Subscribe
- Mute
- Subscribe to RSS Feed
- Permalink
- Notify Moderator
Please log in to access translation
Dec 10, 2013
12:37 PM
Errors in x-axis
Hello,
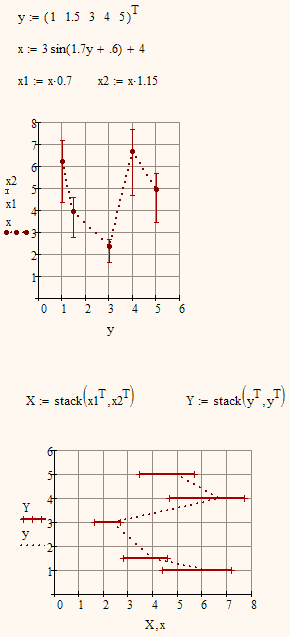
In Mathcad 15, is it possible to add error bars to the x axis of a plot? I have a data series of 10 x values and 10 y values. The error in y is 0 however there are individual errors in each x values and I am wondering if it is possible to add horizontal error bars.
Any help would be appreciated.
Labels:
- Labels:
-
Statistics_Analysis
4 REPLIES 4
Dec 10, 2013
01:25 PM
- Mark as New
- Bookmark
- Subscribe
- Mute
- Subscribe to RSS Feed
- Permalink
- Notify Moderator
Please log in to access translation
Dec 10, 2013
01:25 PM
I am wondering if it is possible to add horizontal error bars.
Not that I am aware of.
Would a transposed plot, plotting x over y instead of y over x be an option?
Dec 10, 2013
01:34 PM
- Mark as New
- Bookmark
- Subscribe
- Mute
- Subscribe to RSS Feed
- Permalink
- Notify Moderator
Please log in to access translation
Dec 10, 2013
01:34 PM
Unfortunately not, it's an x-y phase diagram for adsorbed mole fraction on an adsorbant surface unfortunately. Also as I'm trying to compare the empirical results (data series) with those found using IAST I have had to use a solve block so want to plot that on the same curve, which is why I am wanting to do it on mathcad rather than grace or excel.
Thanks anyway.
Dec 10, 2013
01:53 PM
- Mark as New
- Bookmark
- Subscribe
- Mute
- Subscribe to RSS Feed
- Permalink
- Notify Moderator
Please log in to access translation
Dec 10, 2013
01:53 PM
So you may consider creating your own error plot if the data is in vectors. You will also have the benefit of more control over line thickness.
Dec 10, 2013
08:40 PM
- Mark as New
- Bookmark
- Subscribe
- Mute
- Subscribe to RSS Feed
- Permalink
- Notify Moderator
Please log in to access translation
Dec 10, 2013
08:40 PM
I wrote some functions to do this. I have posted these before, but can't find the thread. See the attached.


