Community Tip - Did you get called away in the middle of writing a post? Don't worry you can find your unfinished post later in the Drafts section of your profile page. X
- Subscribe to RSS Feed
- Mark Topic as New
- Mark Topic as Read
- Float this Topic for Current User
- Bookmark
- Subscribe
- Mute
- Printer Friendly Page
Experimental data best fit
- Mark as New
- Bookmark
- Subscribe
- Mute
- Subscribe to RSS Feed
- Permalink
- Notify Moderator
Experimental data best fit
Hi,
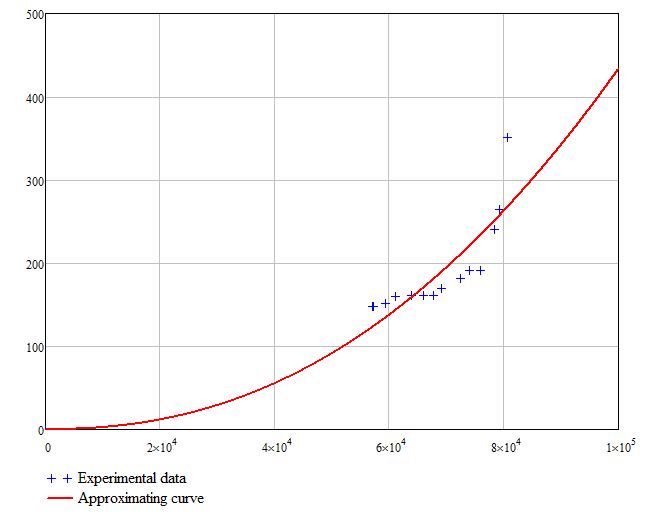
I have some data that have been obtained experimentally. I used the built-in function "genfit" for the selection of the approximating function. I took to be a form of this function like: f(x)=a*x^b. And in this case, I know that the function at the point x = 0 must be zero (f(x_0)=0). Are there any suggestions what other functions can describe the experimental data best way? Thanks.
- Labels:
-
Statistics_Analysis
- Mark as New
- Bookmark
- Subscribe
- Mute
- Subscribe to RSS Feed
- Permalink
- Notify Moderator
It doesn't look from the rest of your data as if f(0)=0 but you should know better, of course.
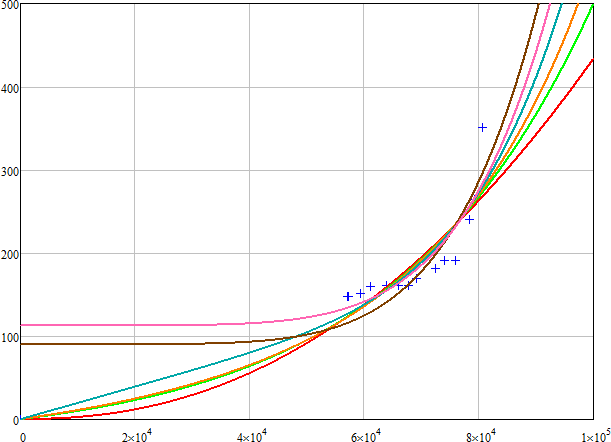
See attached some other fit functions with two parameters.
Don't you know anything about the fit function you should expect?
I think the sorting at the beginning of your file needs some refinement.
- Mark as New
- Bookmark
- Subscribe
- Mute
- Subscribe to RSS Feed
- Permalink
- Notify Moderator
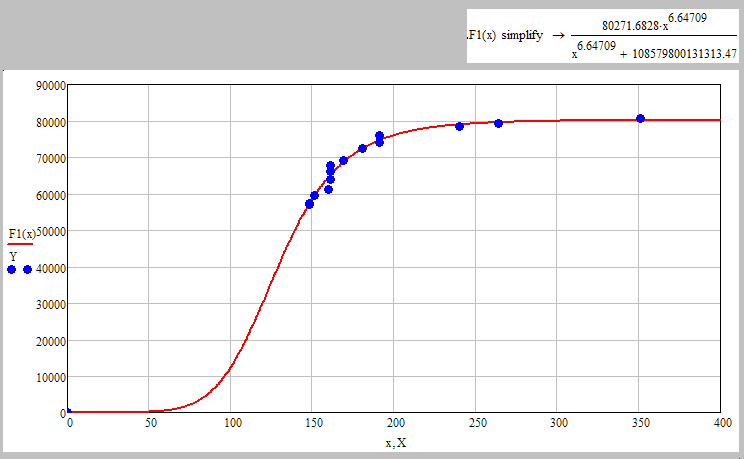
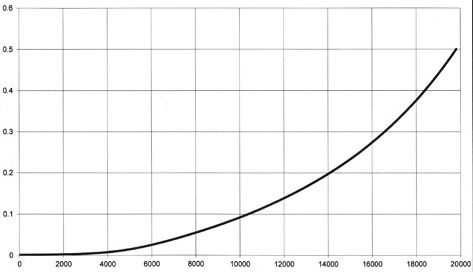
Thank you, Werner. Theoretically the approximating function should look like the figure below. Sorting data at the beginning of the worksheet is not necessary. Experimental data is read from an external file in which the data are sorted in advance.
- Mark as New
- Bookmark
- Subscribe
- Mute
- Subscribe to RSS Feed
- Permalink
- Notify Moderator
One sugestion is to use an "S" shape function and fit it's constants - at least this is what I see (an S-curve shape) looking at the data.
One questions that may help - but I think you thought about this already: Can the process, from where the data come from, be modeled from first principles?
- Mark as New
- Bookmark
- Subscribe
- Mute
- Subscribe to RSS Feed
- Permalink
- Notify Moderator
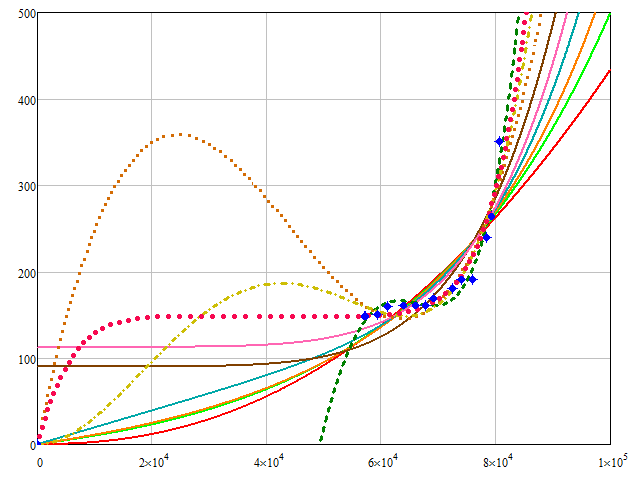
Did you give it a try?
Guess you would need more than two parameters to play with to achieve that.
- Mark as New
- Bookmark
- Subscribe
- Mute
- Subscribe to RSS Feed
- Permalink
- Notify Moderator
Yes, but without any success. I think we need a sigmoid function like this / similar one with more parameters.
- Mark as New
- Bookmark
- Subscribe
- Mute
- Subscribe to RSS Feed
- Permalink
- Notify Moderator
A Gaussian won't give you the S-shape you saw and would be rather similar to a normal exponential fit in this case, I guess.
- Mark as New
- Bookmark
- Subscribe
- Mute
- Subscribe to RSS Feed
- Permalink
- Notify Moderator
An arbitrary order polynomial constrained to go through zero will fit it. But what's the purpose of the fit? If you want to get to the underlying physical parameters, then you need an equation that is derived from the underlying physics. If you just want an arbitrary smooth curve that is a reasonable fit then just fit a polynomial, and ignore the requirement that it goes through zero. An arbitrary function does not have to obey one physical constraint that is well outside the bounds of your data.
- Mark as New
- Bookmark
- Subscribe
- Mute
- Subscribe to RSS Feed
- Permalink
- Notify Moderator
I just need approximation function by with which I can get the intermediate points from the curve.
- Mark as New
- Bookmark
- Subscribe
- Mute
- Subscribe to RSS Feed
- Permalink
- Notify Moderator
Use regress to fit a polynomial. I would post a worksheet, but I have to head off for a very early flight.
- Mark as New
- Bookmark
- Subscribe
- Mute
- Subscribe to RSS Feed
- Permalink
- Notify Moderator
Here is the regression Richard suggested (with and without 0/0).
You can't force the regression through 0/0 (you could add 0/0 multiple times in the data vector) - if thats mandatory you better stay with genfit.
From the suggestions I made earlier, I think that F4(x) (a*x^6 + b*x) will give a good fit and is forced through 0/0.
But it depends on in which interval you would need the approximation/interpolation to be made.
Not sure but maybe even a simple interpolation would suffice. See in attached.
- Mark as New
- Bookmark
- Subscribe
- Mute
- Subscribe to RSS Feed
- Permalink
- Notify Moderator
Thanks. I also noticed that function "F4(x)=(a*x^6 + b*x)" gives good results.
P.S. I'll come back to this discussion when I have new experimental data.
- Mark as New
- Bookmark
- Subscribe
- Mute
- Subscribe to RSS Feed
- Permalink
- Notify Moderator
Here is a slightly improved/speeded up verson of the first part alopng with a selection of different approximations
- Mark as New
- Bookmark
- Subscribe
- Mute
- Subscribe to RSS Feed
- Permalink
- Notify Moderator
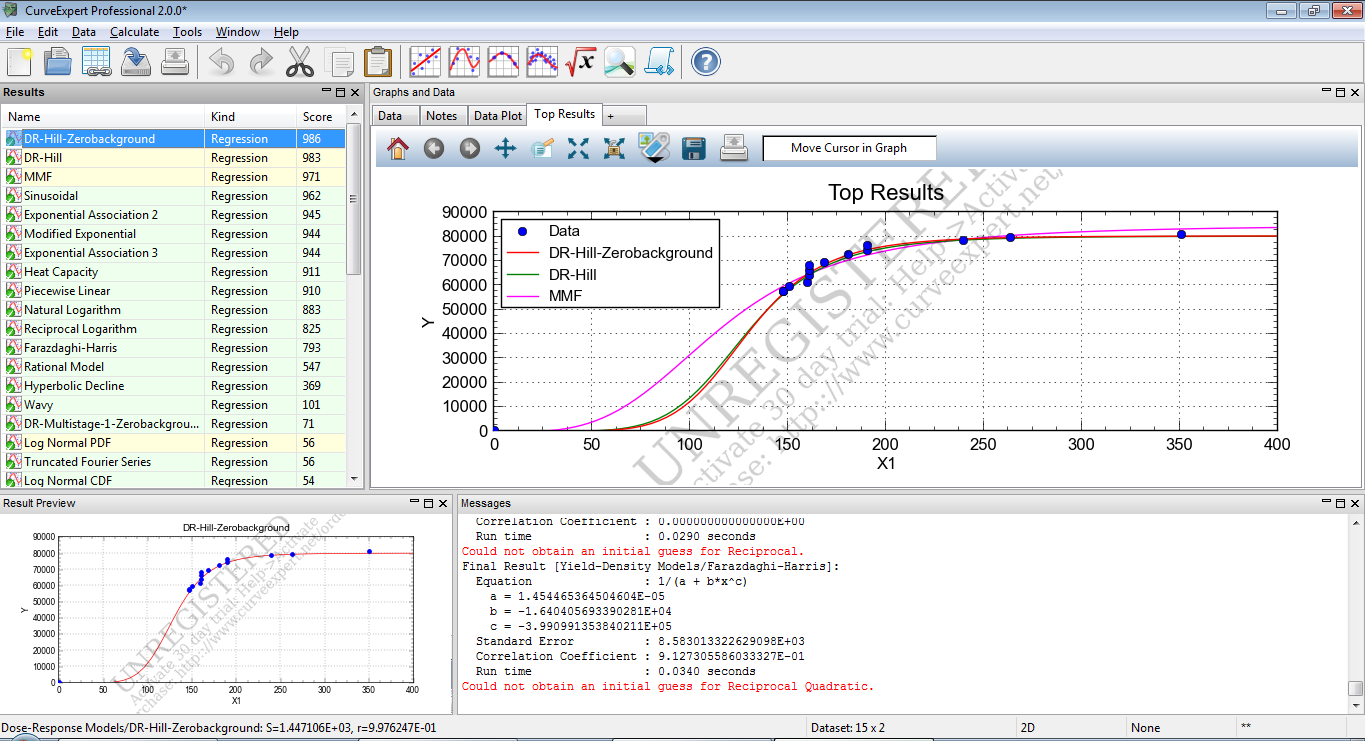
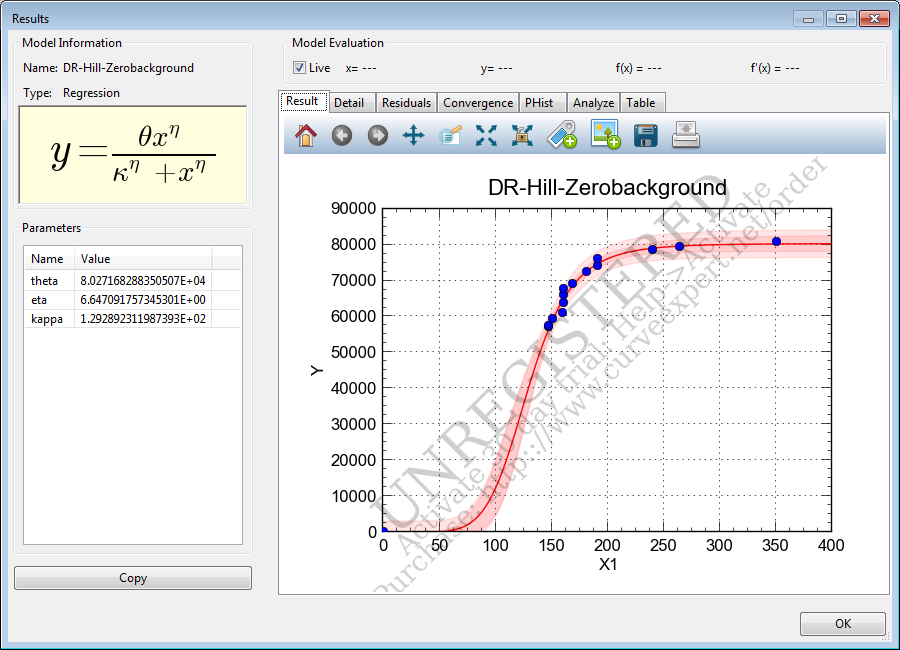
Here are the results produced by the program CurveExpert Professional for "Nonlinear Model Fit":
- Mark as New
- Bookmark
- Subscribe
- Mute
- Subscribe to RSS Feed
- Permalink
- Notify Moderator
You get the same values using Mathcad with those two function types, but genfit is rather sensible with respect to the guess values. A solve block may find solutions which genfit doesn't.
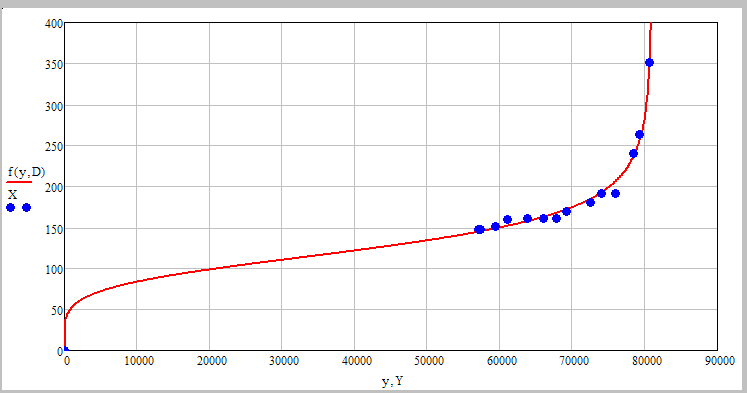
In the file you sent you had used the inverse function, though. So you would have to plot X over Y to get the same.
See attached for more
