Community Tip - Your Friends List is a way to easily have access to the community members that you interact with the most! X
- Subscribe to RSS Feed
- Mark Topic as New
- Mark Topic as Read
- Float this Topic for Current User
- Bookmark
- Subscribe
- Mute
- Printer Friendly Page
Extract Data by 2D Interpolation
- Mark as New
- Bookmark
- Subscribe
- Mute
- Subscribe to RSS Feed
- Permalink
- Notify Moderator
Extract Data by 2D Interpolation
Hello everyone,
I am encountering difficulties setting up a 2D interpolation in Mathcad. My objective is to determine the parameters A, B, C, and D for two given inputs: ratio "r" and delta "δ."
The dataset is categorized into four groups based on Ratios: 0.25, 0.5, 2, and 4. Each group is associated with a specific set of Deltas and corresponding parameters A through D.
While I have managed to interpolate within a single Ratio group, my challenge arises when attempting to interpolate for a ratio value that falls outside these defined groups, such as 3.5. Attached is my Mathcad Prime 7 worksheet for reference. I appreciate any assistance you can provide.
Note: When the delta input "δ" exceeds the highest Delta value in a given Ratio group, the output should correspond to the highest Delta record's values, as extrapolation beyond this point is not allowed.
Solved! Go to Solution.
- Labels:
-
Mathcad Usage
-
Programming
Accepted Solutions
- Mark as New
- Bookmark
- Subscribe
- Mute
- Subscribe to RSS Feed
- Permalink
- Notify Moderator
- Mark as New
- Bookmark
- Subscribe
- Mute
- Subscribe to RSS Feed
- Permalink
- Notify Moderator
Your dataset is somewhat uneven. You don't have values for Ratio=0.5 and Delta=45, nor for Ratio=2 or 4 and Delta=100.
Is that purposely?
Luc
- Mark as New
- Bookmark
- Subscribe
- Mute
- Subscribe to RSS Feed
- Permalink
- Notify Moderator
Hello @LucMeekes , I have updated the record for a Ratio of 0.5 with Delta=45 instead of 100. All other data remains accurate. For a Ratio of 0.25 alone, there are 4 Delta rows, while the other Ratios have 3 Delta rows each.
Additionally, I've attached the updated worksheet in the Prime 9 version with a solution that I managed to implement using a brute force method. It is functioning as expected, despite being a brute force approach.
- Mark as New
- Bookmark
- Subscribe
- Mute
- Subscribe to RSS Feed
- Permalink
- Notify Moderator
0. Make all Delta=100 data by linterp function.

1. Using Bicubic2D function.
2. Using Werner_E's linterp_2D function.
- Mark as New
- Bookmark
- Subscribe
- Mute
- Subscribe to RSS Feed
- Permalink
- Notify Moderator
Thank you @ttokoro san, please attach your Mathcad prime file, I want to study it.
- Mark as New
- Bookmark
- Subscribe
- Mute
- Subscribe to RSS Feed
- Permalink
- Notify Moderator
Attach it.
linterp_2D function is made by Werner_E.
- Mark as New
- Bookmark
- Subscribe
- Mute
- Subscribe to RSS Feed
- Permalink
- Notify Moderator
You may also try splineInter_2D() for a similar result like Bicubic2D
- Mark as New
- Bookmark
- Subscribe
- Mute
- Subscribe to RSS Feed
- Permalink
- Notify Moderator
Thank you @Werner_E and @ttokoro san,
I tested the functions, and they are working correctly.
My next step is to research the data set to determine the most appropriate interpolation method, piecewise polynomial or linear. For instance, for Data Set A, polynomial interpolation produces a smooth peak when transitioning from a ratio of 2 to 4 for low Delta values. Any A value interpolated in that range will be higher compared to the linear interpolation method.
Below are the comparison results between my implementation (2D linear) and yours.
- Mark as New
- Bookmark
- Subscribe
- Mute
- Subscribe to RSS Feed
- Permalink
- Notify Moderator
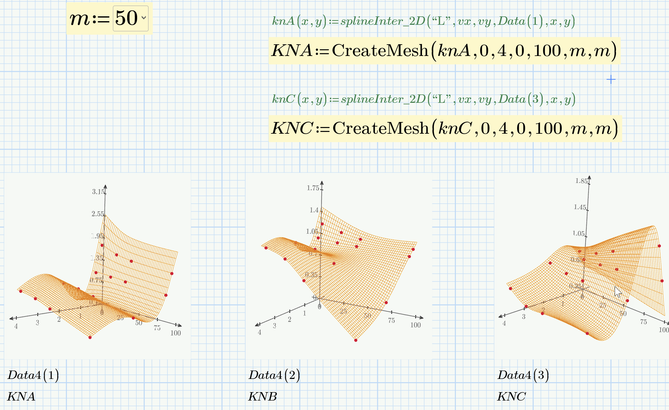
The difference is caused by the behavior of two functions. SplineInter_2D shows more flat shape. And linterp_2D fit all points data on the plot.
- Mark as New
- Bookmark
- Subscribe
- Mute
- Subscribe to RSS Feed
- Permalink
- Notify Moderator
Thank you @ttokoro san,
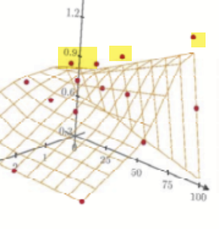
This is a good comparison plot. I will consult the data owner on their preferred method and assess the downstream impact of using the higher value. Please attach the Mathcad file so I can examine how to add the green point to the plot.
こちらは良い比較のプロットですね。@ttokoroさん、ありがとうございます。データの所有者に、好みの方法について相談します。また、より高い値を使用した場合の下流への影響を評価します。プロットに緑の点を追加する方法を検討するために、Mathcadファイルを添付してください。
- Mark as New
- Bookmark
- Subscribe
- Mute
- Subscribe to RSS Feed
- Permalink
- Notify Moderator
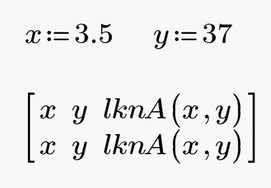
To add a single point in a 3D plot you have to plot that point twice, otherwise an error is thrown.
Assign the x- and y values and then let the 2x3 matrix shown below be plotted.
What irritates me on @ttokoro 's picture is this
even though he seems to just use interpolations and not a fitting function some points seem to be not part of the surface which should not happen when using an interpolation. But maybe thats just because of a bad choice for the grid size. Can't tell as @ttokoro unfortunately as usual did not attach the worksheet in fist place (but he sure will do later because you asked for it).
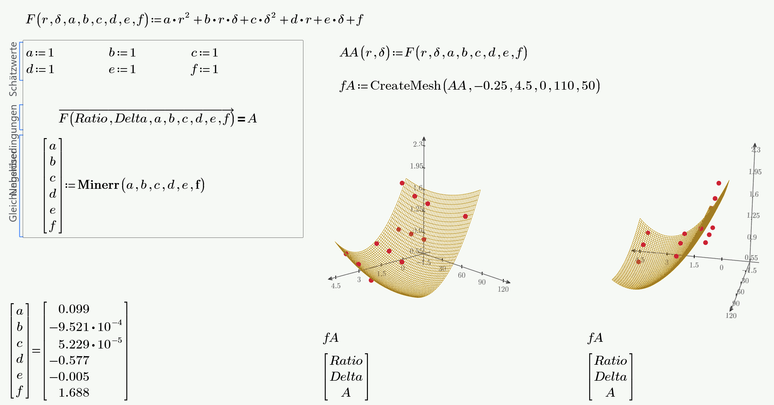
Speaking of surface fitting instead of interpolation - you just have 13 points of the surface at hand. Thats quite few but you can fit any surface function to the data anyway using a solve block with "minerr". Not sure what the final intention is and IMHO a surface fit only makes sense if you know what kind of process the data stems from and what kind of (surface) function the data can be assumed to lie on.
Here an example where a simple polynomial function of second order is fitted to the data. As you can see, the fit is pretty bad and a lot of the data points are way off the surface
This was just an example to demonstrate the use of the solve block. For polynomial fits you would rather use the built-in "polyfit" function which is much more convenient.
In the next picture you see polynomial fits of third and fourth order
Prime 9 file attached
- Mark as New
- Bookmark
- Subscribe
- Mute
- Subscribe to RSS Feed
- Permalink
- Notify Moderator
Werner_E shows how to do it.
Attach new sheet includes mesh number select combo box.
- Mark as New
- Bookmark
- Subscribe
- Mute
- Subscribe to RSS Feed
- Permalink
- Notify Moderator
- Mark as New
- Bookmark
- Subscribe
- Mute
- Subscribe to RSS Feed
- Permalink
- Notify Moderator
CreateMesh makes data for Adata(x,y) of x from 0 to 4 and y from 0 to 100. So if you want x from 0.25 and y from 5, just change CreateMesh(Adata,0.25,4,5,100, number of x mesh, number of y mesh).
- Mark as New
- Bookmark
- Subscribe
- Mute
- Subscribe to RSS Feed
- Permalink
- Notify Moderator
It's working correctly. This allows me to visually verify that the interpolated value falls within the defined surface area dictated by the available data.
- Mark as New
- Bookmark
- Subscribe
- Mute
- Subscribe to RSS Feed
- Permalink
- Notify Moderator
If you want to know how to use built in functions, just point on the function you want to know and put F1 kye to view the help.


