Community Tip - Want the oppurtunity to discuss enhancements to PTC products? Join a working group! X
- Subscribe to RSS Feed
- Mark Topic as New
- Mark Topic as Read
- Float this Topic for Current User
- Bookmark
- Subscribe
- Mute
- Printer Friendly Page
Extract data from chart
- Mark as New
- Bookmark
- Subscribe
- Mute
- Subscribe to RSS Feed
- Permalink
- Notify Moderator
Extract data from chart
Hi,
Usually, data are given by a chart/figure in picture form, such as JPG,TIF,BMP,PNG...
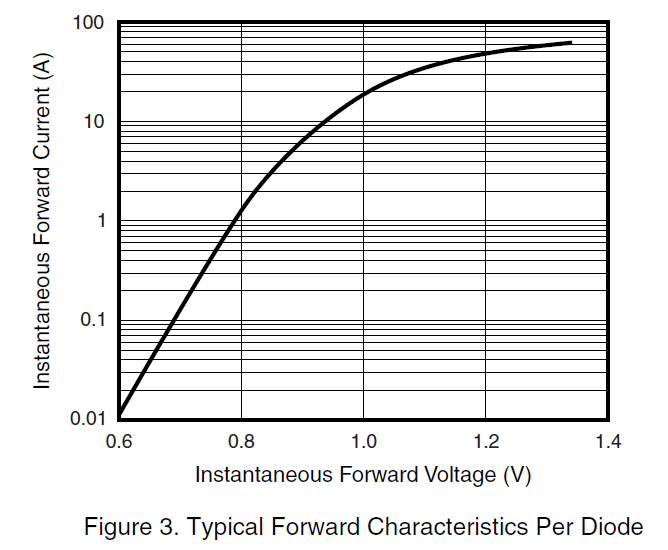
Like below, it is the V-I charactristic of a diode.

I want to get the V and corresponding I value, then I can get a fit function V(I) (or I(V) ).
Although,we can read several more exact points by eye-measurement, and then get a fit function. I think the fit function will be more precise if we read more points.
How can I do to extract as much points as possible? Any help will be appriciated.
My MC version is "Mathcad 15 F000".
Solved! Go to Solution.
Accepted Solutions
- Mark as New
- Bookmark
- Subscribe
- Mute
- Subscribe to RSS Feed
- Permalink
- Notify Moderator
- Mark as New
- Bookmark
- Subscribe
- Mute
- Subscribe to RSS Feed
- Permalink
- Notify Moderator
- Mark as New
- Bookmark
- Subscribe
- Mute
- Subscribe to RSS Feed
- Permalink
- Notify Moderator
So funny. Let me see.
Thank you!
- Mark as New
- Bookmark
- Subscribe
- Mute
- Subscribe to RSS Feed
- Permalink
- Notify Moderator
Why don't clean the curve to get rid of useless points fistly by some tools,like mspaint or photoshop?
- Mark as New
- Bookmark
- Subscribe
- Mute
- Subscribe to RSS Feed
- Permalink
- Notify Moderator
盗版 用户 wrote:
Why don't clean the curve to get rid of useless points fistly by some tools,like mspaint or photoshop?
Feel free to do so. The sheet Richard sent is an attempt to be a standalone approach. If you are willing to use third party software, you may chose to use a program like DataThief right away.
Alvaro Diazo one posted a sheet long time ago which enabled you to do some kind of manual digitizing. Maybe of interest. The most recent link I could find is this where Norm reposted it: http://communities.ptc.com/message/226096#226096
- Mark as New
- Bookmark
- Subscribe
- Mute
- Subscribe to RSS Feed
- Permalink
- Notify Moderator
Thank you.
Deal with the scale of the XY axes is another queary. In my figure Y axis is logarithmic scale, but yours are linear.
Let me seeeeee
- Mark as New
- Bookmark
- Subscribe
- Mute
- Subscribe to RSS Feed
- Permalink
- Notify Moderator
I personally don't use the sheet at all. I posted it because you asked for a solution in Mathcad. I have a piece of software called Un-Scan-It, which does a much better job. And yes, I sometimes clean the image up in Photoshop or Photopaint first.


