Community Tip - Have a PTC product question you need answered fast? Chances are someone has asked it before. Learn about the community search. X
- Subscribe to RSS Feed
- Mark Topic as New
- Mark Topic as Read
- Float this Topic for Current User
- Bookmark
- Subscribe
- Mute
- Printer Friendly Page
Finding which combination of values gives the highest/lowest result
- Mark as New
- Bookmark
- Subscribe
- Mute
- Subscribe to RSS Feed
- Permalink
- Notify Moderator
Finding which combination of values gives the highest/lowest result
I've been scouring the forums for a while now and I'm starting to come to the conclusion that either my question is so simple that nobody else needs to ask how to do it or that it just can't be done. Put simply, I'm trying to find out how I can get MathCAD (using Prime 4.0) to return the highest or lowest result of a function given a list of possible input variables.
For example, if I have a simple function:
f(x,y) = x + y^2
and a list of possible values for x and y:
x = [3, -6, 2]
y = [2, 3, -3]
How can I get MathCAD to output the largest (11) or smallest (-2) result?
Solved! Go to Solution.
Accepted Solutions
- Mark as New
- Bookmark
- Subscribe
- Mute
- Subscribe to RSS Feed
- Permalink
- Notify Moderator
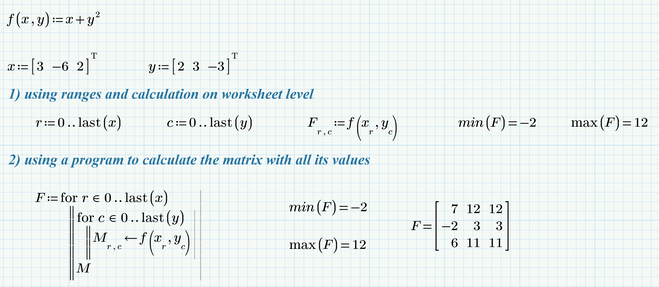
Here are a few ways to do it
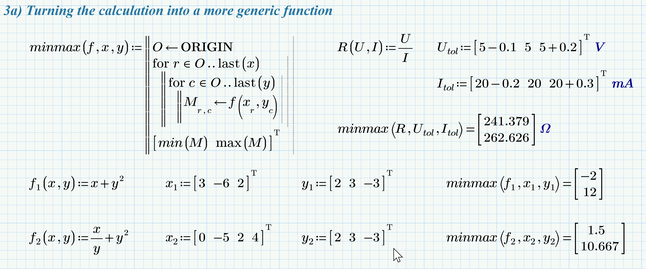
But I would prefer to write a utility function to do the job
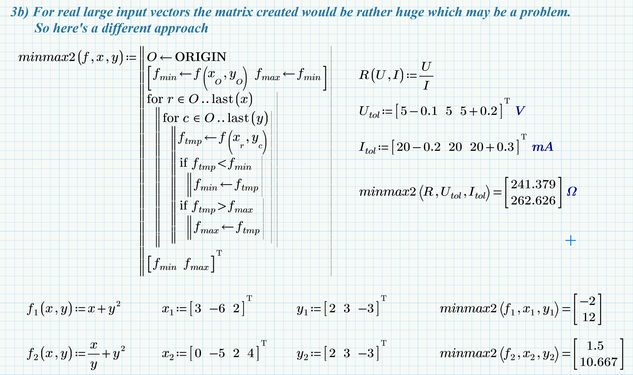
Sometimes it may be a problem to have the function create the full matrix, so a different, a little bit more lengthy approach would do the same job:
Worksheet in format P4 attached
EDIT: I just remembered that there was a similar, but more coomplicated/demanding question here in this thread
There you can find a minmax function which will work with function with more than just two arguments. Not sure which version the file attached there is, but I guess the thread is old enough so the file should open with P4.
- Mark as New
- Bookmark
- Subscribe
- Mute
- Subscribe to RSS Feed
- Permalink
- Notify Moderator
That is probably the most thorough and well-documented answer I've ever received! Thank you so much!
- Mark as New
- Bookmark
- Subscribe
- Mute
- Subscribe to RSS Feed
- Permalink
- Notify Moderator
In the 2nd line in your 1st screenshot, why is there a "T" superscript on the bracketed numbers for x and y
- Mark as New
- Bookmark
- Subscribe
- Mute
- Subscribe to RSS Feed
- Permalink
- Notify Moderator
That 'superscript T' is the transpose operator.
It turns a row vector into a column vector:
a column vector into a row vector:
and exchanges rows and columns in a matrix:
Success!
Luc
- Mark as New
- Bookmark
- Subscribe
- Mute
- Subscribe to RSS Feed
- Permalink
- Notify Moderator
@AL_9913769 wrote:
In the 2nd line in your 1st screenshot, why is there a "T" superscript on the bracketed numbers for x and y
Luc already explained the meaning of the transpose operator.
The question about the "why" I used it is simply answered: To save vertical space. It makes the worksheet looking a bit cleaner when a column vector is defined as a transposed row vector 😉
The same goes for the evaluation/display of a vector. Often its preferable to display it transposed in a row rather then the vector display taking up multiple lines in the text.


