Community Tip - Visit the PTCooler (the community lounge) to get to know your fellow community members and check out some of Dale's Friday Humor posts! X
- Subscribe to RSS Feed
- Mark Topic as New
- Mark Topic as Read
- Float this Topic for Current User
- Bookmark
- Subscribe
- Mute
- Printer Friendly Page
Graph in Mathcad
- Mark as New
- Bookmark
- Subscribe
- Mute
- Subscribe to RSS Feed
- Permalink
- Notify Moderator
Graph in Mathcad
Hi,
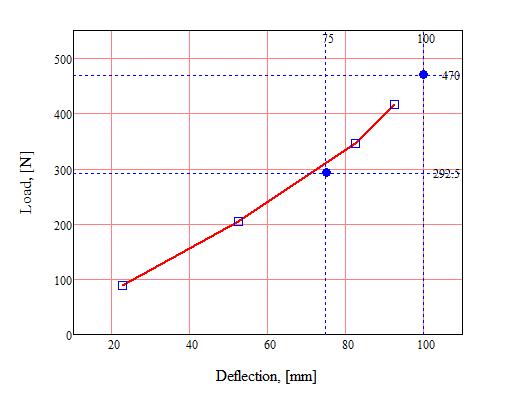
Find the attached image. How to plot such a graph in Mathcad 15?
--
Dhinesh
Solved! Go to Solution.
- Labels:
-
Statistics_Analysis
Accepted Solutions
- Mark as New
- Bookmark
- Subscribe
- Mute
- Subscribe to RSS Feed
- Permalink
- Notify Moderator
Please see attached. I have used the Lines function to create the vertical lines on the X-axis, but had to use vector's to create the lines on the Y-axis. It works, but looks untidy. I'll have a go at writing a function for the Y-axis now.
Mike
- Mark as New
- Bookmark
- Subscribe
- Mute
- Subscribe to RSS Feed
- Permalink
- Notify Moderator
Can you provide a worksheet with the data?
I'm sure the graph can be done, but too lazy to type the data out ![]()
Mike
- Mark as New
- Bookmark
- Subscribe
- Mute
- Subscribe to RSS Feed
- Permalink
- Notify Moderator
Mike,
pfa
I know the graph can be plotted.
But I need similar kind of output as in image.
--
Dhinesh
- Mark as New
- Bookmark
- Subscribe
- Mute
- Subscribe to RSS Feed
- Permalink
- Notify Moderator
Please see attached. I have used the Lines function to create the vertical lines on the X-axis, but had to use vector's to create the lines on the Y-axis. It works, but looks untidy. I'll have a go at writing a function for the Y-axis now.
Mike
- Mark as New
- Bookmark
- Subscribe
- Mute
- Subscribe to RSS Feed
- Permalink
- Notify Moderator
Here's a small modification to Mike's program that does all the lines automatically.
Alan
- Mark as New
- Bookmark
- Subscribe
- Mute
- Subscribe to RSS Feed
- Permalink
- Notify Moderator
Here's a small modification to Mike's program that does all the lines automatically.
Nice mod Alan, I was just trying to change it before your post.
Well done.
Mike
- Mark as New
- Bookmark
- Subscribe
- Mute
- Subscribe to RSS Feed
- Permalink
- Notify Moderator
Mike/Alan,
Can you please expalin the program and how its working?
I am new to Mathcad and am not good in programming.
Thanks in advance
--
Dhinesh
- Mark as New
- Bookmark
- Subscribe
- Mute
- Subscribe to RSS Feed
- Permalink
- Notify Moderator
Can you please expalin the program and how its working? I am new to Mathcad and am not good in programming.
If I was you I wouldn't be too concerned at this time how the program works, just file it and know how to utilize it.
It basically creates a Matrix of the data to be plotted and then the Re(x) and Im(x) functions are used to create the graph. The Re(x) function plots the real part of the matrix, in this case called Lines and Im(x) plots the imaginary part.
Mike
- Mark as New
- Bookmark
- Subscribe
- Mute
- Subscribe to RSS Feed
- Permalink
- Notify Moderator
Hello!
The easiest and fastest way is as follows:

- Mark as New
- Bookmark
- Subscribe
- Mute
- Subscribe to RSS Feed
- Permalink
- Notify Moderator
Vladimir,
Which graph option I have to use? What are the settings I have to do?
--
Dhinesh
- Mark as New
- Bookmark
- Subscribe
- Mute
- Subscribe to RSS Feed
- Permalink
- Notify Moderator
The settings for plot can be changed using tab "Formatting" (right click on the plot and choose in the list "Format .."). Basic tab with which it is necessary to work it- "XY Axes", "Traces", "Labels".
P.S. I have attached to the message file for Mathcad 15.
- Mark as New
- Bookmark
- Subscribe
- Mute
- Subscribe to RSS Feed
- Permalink
- Notify Moderator
I also recommend reading books on the program Mathcad. For example, Brent Maxfield "Engineering with Mathcad".


