
Turn on suggestions
Auto-suggest helps you quickly narrow down your search results by suggesting possible matches as you type.
Showing results for
Please log in to access translation
Turn on suggestions
Auto-suggest helps you quickly narrow down your search results by suggesting possible matches as you type.
Showing results for
Community Tip - Learn all about the Community Ranking System, a fun gamification element of the PTC Community. X
Translate the entire conversation x
Please log in to access translation
Options
- Subscribe to RSS Feed
- Mark Topic as New
- Mark Topic as Read
- Float this Topic for Current User
- Bookmark
- Subscribe
- Mute
- Printer Friendly Page
Help please - plotting curve as a series of functions
Jan 15, 2013
07:25 AM
- Mark as New
- Bookmark
- Subscribe
- Mute
- Subscribe to RSS Feed
- Permalink
- Notify Moderator
Please log in to access translation
Jan 15, 2013
07:25 AM
Help please - plotting curve as a series of functions
Hi,
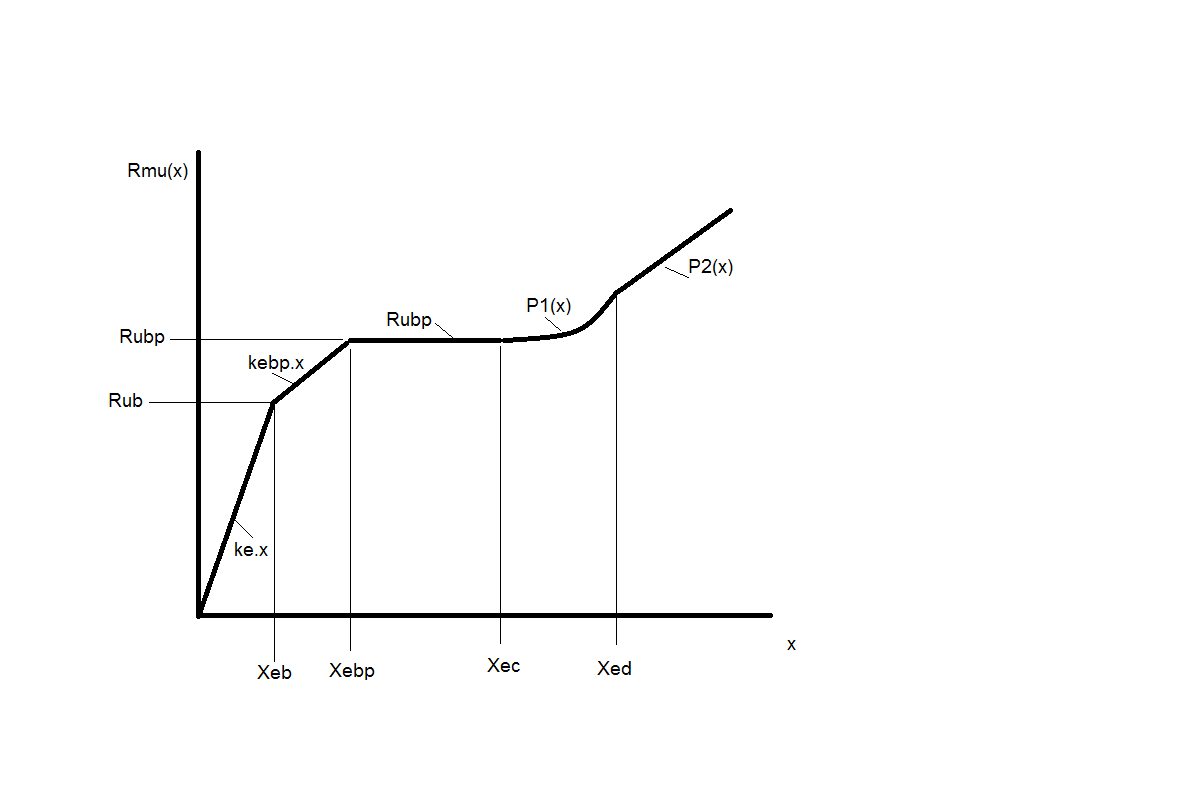
Attached is a mathcad worksheet - when you scroll down you will see a set of questions to my problem and a plot of the function that I have produced to try and plot the curve that I want. The curve I wish to plot should look something like the sketch attached (see curve_sketch file) Plot points on the sketch refer to the nomenclature in the mathcad file.
Can you please read the questions in matchad file and advise how best to plot the individual functions of the curve?
Many thanks
Omar
Solved! Go to Solution.
Labels:
- Labels:
-
Other
ACCEPTED SOLUTION
Accepted Solutions
Jan 15, 2013
09:49 AM
- Mark as New
- Bookmark
- Subscribe
- Mute
- Subscribe to RSS Feed
- Permalink
- Notify Moderator
Please log in to access translation
Jan 15, 2013
09:49 AM
If you normalise the x parameter for each stage
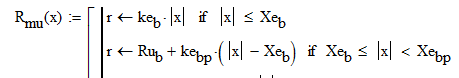
here mod(x)-Xeb then the start point needs a constant added, equal to the result from the previous stage at Xeb in this case already calculated as Rub.
If you calculate everything as mod(x) here, saving the result as a local variable (r).
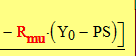
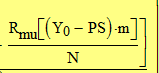
Then the final answer can be returned as

Regards
Andy
10 REPLIES 10
Jan 15, 2013
07:38 AM
- Mark as New
- Bookmark
- Subscribe
- Mute
- Subscribe to RSS Feed
- Permalink
- Notify Moderator
Please log in to access translation
Jan 15, 2013
07:38 AM
I'll take a look when I have some more time.
In the meantime maybe the following link will be of help concerning plotting of piecewise defined functions.
Jan 15, 2013
08:56 AM
- Mark as New
- Bookmark
- Subscribe
- Mute
- Subscribe to RSS Feed
- Permalink
- Notify Moderator
Please log in to access translation
Jan 15, 2013
08:56 AM
Thanks Werner
Jan 15, 2013
09:48 AM
- Mark as New
- Bookmark
- Subscribe
- Mute
- Subscribe to RSS Feed
- Permalink
- Notify Moderator
Please log in to access translation
Jan 15, 2013
10:54 AM
- Mark as New
- Bookmark
- Subscribe
- Mute
- Subscribe to RSS Feed
- Permalink
- Notify Moderator
Please log in to access translation
Jan 15, 2013
10:54 AM
Hi Fred, thanks for your approach it solves plotting the curve correctly. If you read my response below to Andy I upload a further file - there is a scaler issue in my differential equation that I need to fix to solve my problem.
Many thanks
Omar
Jan 15, 2013
09:49 AM
- Mark as New
- Bookmark
- Subscribe
- Mute
- Subscribe to RSS Feed
- Permalink
- Notify Moderator
Please log in to access translation
Jan 15, 2013
09:49 AM
If you normalise the x parameter for each stage
here mod(x)-Xeb then the start point needs a constant added, equal to the result from the previous stage at Xeb in this case already calculated as Rub.
If you calculate everything as mod(x) here, saving the result as a local variable (r).
Then the final answer can be returned as
Regards
Andy
Jan 15, 2013
10:25 AM
- Mark as New
- Bookmark
- Subscribe
- Mute
- Subscribe to RSS Feed
- Permalink
- Notify Moderator
Please log in to access translation
Jan 15, 2013
10:25 AM
Hi Andy,
That's great you've solved the problem for plotting the curve. However I encounter another problem when I apply the curve to my differential equation which I solve using the Runge Kutta method. I have attached an updated version of the mathcad file - if you can please take a look and let me know how I resolve the scaler issue so it solves the differential equation.
Many thanks
Omar
Jan 15, 2013
11:27 AM
- Mark as New
- Bookmark
- Subscribe
- Mute
- Subscribe to RSS Feed
- Permalink
- Notify Moderator
Please log in to access translation
Jan 15, 2013
11:27 AM
Hi Omar,
2 problems:
1
You have Rmu * (...
It should be just Rmu(...
& 2
Rmu is set for parameter in m and returning value as N
All the other functions only return number results (no units)
If you remove the units from Rmu (as above) you get an answer.
However, I have tried adding units to the other equations & still get errors!!
So possible that the answer given may not be correct.
Regards
Andy
Jan 15, 2013
11:36 AM
- Mark as New
- Bookmark
- Subscribe
- Mute
- Subscribe to RSS Feed
- Permalink
- Notify Moderator
Please log in to access translation
Jan 15, 2013
11:36 AM
Hi Andy
I have tried removing Rmu units as shown however don't get an answer. Can you please provide your worksheet with answer?
Thanks
Omar
Jan 15, 2013
11:50 AM
- Mark as New
- Bookmark
- Subscribe
- Mute
- Subscribe to RSS Feed
- Permalink
- Notify Moderator
Please log in to access translation
Jan 15, 2013
11:50 AM
Hi Omar,
Don't think that I diod anything else to the sheet, so here it is.
If you spot a difference, please let me know
Regards
Andy
Jan 15, 2013
12:34 PM
- Mark as New
- Bookmark
- Subscribe
- Mute
- Subscribe to RSS Feed
- Permalink
- Notify Moderator
Please log in to access translation
Jan 15, 2013
12:34 PM
Hi Andy
That works and gives me the sollution i'm looking for. Thank you for your help with this.
Kind regards
Omar


