
Turn on suggestions
Auto-suggest helps you quickly narrow down your search results by suggesting possible matches as you type.
Showing results for
Please log in to access translation
Turn on suggestions
Auto-suggest helps you quickly narrow down your search results by suggesting possible matches as you type.
Showing results for
Community Tip - Visit the PTCooler (the community lounge) to get to know your fellow community members and check out some of Dale's Friday Humor posts! X
Translate the entire conversation x
Please log in to access translation
Options
- Subscribe to RSS Feed
- Mark Topic as New
- Mark Topic as Read
- Float this Topic for Current User
- Bookmark
- Subscribe
- Mute
- Printer Friendly Page
How can I change this graph?
Dec 06, 2014
01:38 AM
- Mark as New
- Bookmark
- Subscribe
- Mute
- Subscribe to RSS Feed
- Permalink
- Notify Moderator
Please log in to access translation
Dec 06, 2014
01:38 AM
How can I change this graph?
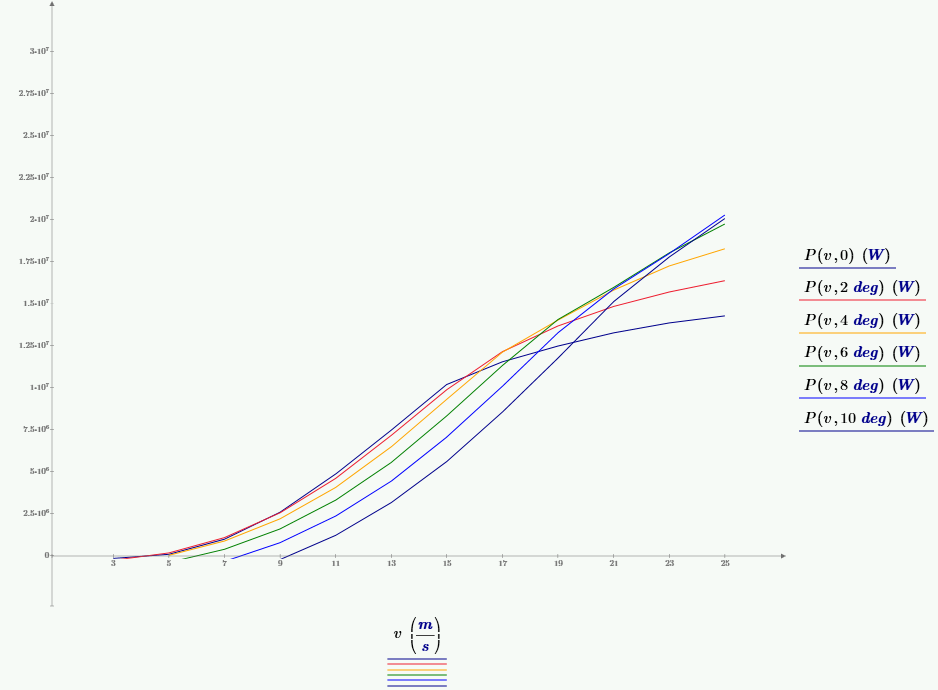
I want to find each point when it reach 5*10^6.
And then I want to connect each point.
when all work is finished, it will be made one line.
could you give me advice?
Labels:
- Labels:
-
Other
15 REPLIES 15
Dec 06, 2014
06:48 AM
- Mark as New
- Bookmark
- Subscribe
- Mute
- Subscribe to RSS Feed
- Permalink
- Notify Moderator
Please log in to access translation
Dec 06, 2014
06:48 AM
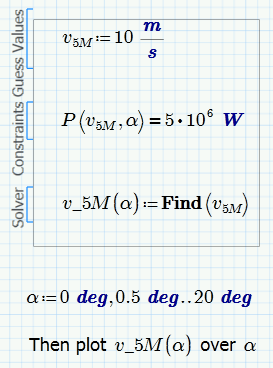
Maybe something like this:
Dec 06, 2014
07:31 AM
- Mark as New
- Bookmark
- Subscribe
- Mute
- Subscribe to RSS Feed
- Permalink
- Notify Moderator
Please log in to access translation
Dec 06, 2014
07:31 AM
Thanks Werner
Dec 06, 2014
08:27 AM
- Mark as New
- Bookmark
- Subscribe
- Mute
- Subscribe to RSS Feed
- Permalink
- Notify Moderator
Please log in to access translation
Dec 06, 2014
08:27 AM
I think you misunderstand my thinking
I want to express a line.
you can see a line "5*10^6"
P(v,theta) is variable when theta is changed.
All curve cross a line. and the dotes are exist when "5*10^6" line is crossed
I want to connect these dotes. After that, I want that it express "plot"
Dec 06, 2014
09:48 AM
- Mark as New
- Bookmark
- Subscribe
- Mute
- Subscribe to RSS Feed
- Permalink
- Notify Moderator
Please log in to access translation
Dec 06, 2014
09:48 AM
If Werner misunderstands what you want, then so do I. Werner proposed creating a solve block that is a function, v_5M, that will return the value of v that makes P equal to 5*10^6 W, for a given angle alpha. So then you can plot that value of v versus the angle, alpha. If you don't want a plot of v versus angle (alpha or theta), what do you want to plot?
Dec 06, 2014
10:43 AM
- Mark as New
- Bookmark
- Subscribe
- Mute
- Subscribe to RSS Feed
- Permalink
- Notify Moderator
Please log in to access translation
Dec 06, 2014
10:43 AM
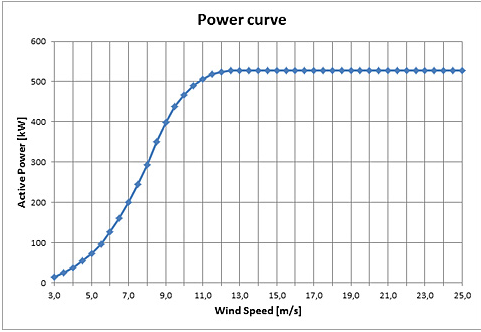
I want to express following picture shape.
thank you for answering my question
Dec 06, 2014
10:34 AM
- Mark as New
- Bookmark
- Subscribe
- Mute
- Subscribe to RSS Feed
- Permalink
- Notify Moderator
Please log in to access translation
Dec 06, 2014
10:34 AM
jinsuk Lee wrote:
I think you misunderstand my thinking
Thats quite possible.
I want to express a line.
you can see a line "5*10^6"
Yes, but obviously that horizontal marker is not what you are after.
P(v,theta) is variable when theta is changed.
I know that P is a function in speed and angle.
All curve cross a line. and the dotes are exist when "5*10^6" line is crossed
Yes, and my function v_M5(alpha) will get you the speed v for which P(v, alpha) equals that value (5 MW). This should help you to get the "dots" you are talking about.
I want to connect these dotes. After that, I want that it express "plot"
From what you describe here, all you would get is a horizontal straight line segment. I can hardly imagine that that is what you want.
So it would be necessary that you describe in a better way what you are after and what exactly you would like to see in your new plot.
Dec 06, 2014
10:44 AM
- Mark as New
- Bookmark
- Subscribe
- Mute
- Subscribe to RSS Feed
- Permalink
- Notify Moderator
Please log in to access translation
Dec 06, 2014
10:44 AM

Werner, I want to express following picture.
your method is possible to express it?
Dec 06, 2014
11:00 AM
- Mark as New
- Bookmark
- Subscribe
- Mute
- Subscribe to RSS Feed
- Permalink
- Notify Moderator
Please log in to access translation
Dec 06, 2014
11:00 AM
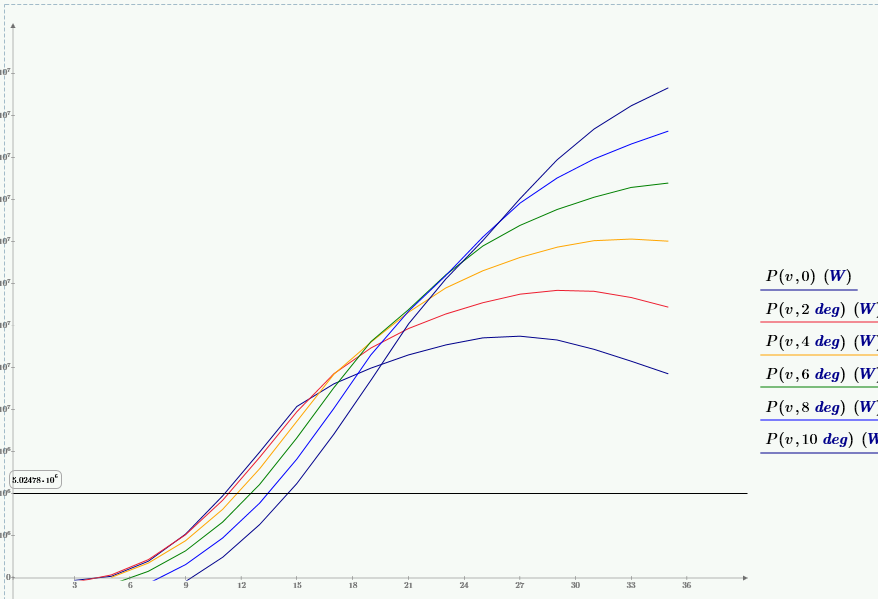
We see a completely different power function here than the one you provided.
How does this relate to your original question (5 MW line)?
You already have the plot power versus speed.
May I ask what you mathematical and your technical background is?
Dec 06, 2014
11:09 AM
- Mark as New
- Bookmark
- Subscribe
- Mute
- Subscribe to RSS Feed
- Permalink
- Notify Moderator
Please log in to access translation
Dec 06, 2014
11:09 AM
But my curve don't stop when p is 5*10^6.
continually, it increase such as following picture
I need to stop when p is 5MW depending on each theta.
when each theta dotes are get, they can connect look like a line.
therefore, when all work finished, I can express upper a completed picture.
Do you understand?
Dec 06, 2014
11:19 AM
- Mark as New
- Bookmark
- Subscribe
- Mute
- Subscribe to RSS Feed
- Permalink
- Notify Moderator
Please log in to access translation
Dec 06, 2014
11:19 AM
jinsuk Lee wrote:
But my curve don't stop when p is 5*10^6.
continually, it increase such as following picture
I need to stop when p is 5MW depending on each theta.
So the question was that the power functions you created do not look like the ones you expected and we should know by looking at the picture what you have done wrong? Very optimistic, indeed.
It looks your calculations are wrong and you arrived at a completely wrong power function. Do you rally want to cut it off like P(v,theta):=if(P(v,theta)>5*10^6 W, 5*10^6 W; P(v,theta)). This would look to crude for me.
Usually what you experience means that you have to go back to the very beginning, find the error in your calculation or in your thoughts and do it all again.
I am sorry to say so, but I get the impression that you are desperately swamped by the task you are working on and that your inexperience with Mathcad and the English language is just a small part of the problem. Maybe it would be a good idea to go out and search technical/mathematical help in your surroundings.
Dec 06, 2014
11:40 AM
- Mark as New
- Bookmark
- Subscribe
- Mute
- Subscribe to RSS Feed
- Permalink
- Notify Moderator
Please log in to access translation
Dec 06, 2014
11:40 AM
Oh no.
my work is not wrong. I checked.
I need to transform my graph.
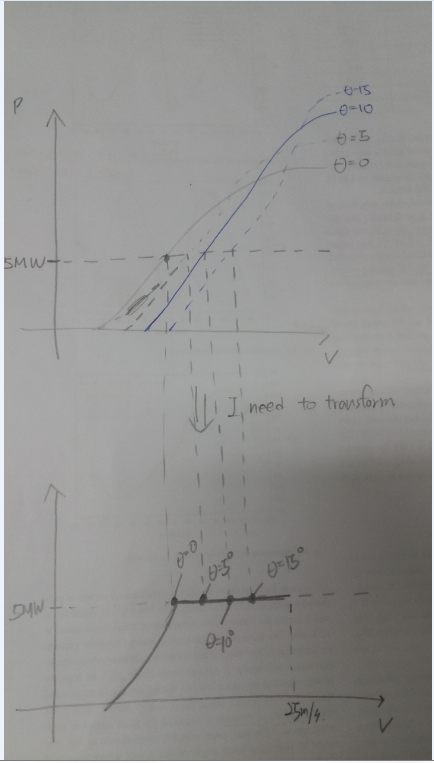
I can get eah dote abou theta when P is 5MW
I need to make a line by connecting each dote.
After all wor is finshed, I can get upper power curve that I draw.
Is it possible to express by using "IF function"?
Dec 06, 2014
12:20 PM
- Mark as New
- Bookmark
- Subscribe
- Mute
- Subscribe to RSS Feed
- Permalink
- Notify Moderator
Please log in to access translation
Dec 06, 2014
12:20 PM
Is it possible to express by using "IF function"?
Why don't you give it a try?
Dec 06, 2014
12:26 PM
- Mark as New
- Bookmark
- Subscribe
- Mute
- Subscribe to RSS Feed
- Permalink
- Notify Moderator
Please log in to access translation
Dec 06, 2014
12:26 PM
I don't see that the angles have anything to do with what you are asking for. You just need
P:=if(P<5MW,P,5MW)
I doubt that has anything to do with reality, but it will give you a graph that never gets higher than 5MW.
Dec 07, 2014
12:50 AM
- Mark as New
- Bookmark
- Subscribe
- Mute
- Subscribe to RSS Feed
- Permalink
- Notify Moderator
Please log in to access translation
Dec 07, 2014
12:50 AM
thank you~
Dec 07, 2014
04:29 AM
- Mark as New
- Bookmark
- Subscribe
- Mute
- Subscribe to RSS Feed
- Permalink
- Notify Moderator
Please log in to access translation
Dec 07, 2014
04:29 AM
I clear my mission. it is due to just" CTOL".
I changed value "CTOL" and then I solve my problem
Thank you Werner and Richard.


