Community Tip - Need to share some code when posting a question or reply? Make sure to use the "Insert code sample" menu option. Learn more! X
- Subscribe to RSS Feed
- Mark Topic as New
- Mark Topic as Read
- Float this Topic for Current User
- Bookmark
- Subscribe
- Mute
- Printer Friendly Page
How can i find the best distribution: weibull or exponential distribution for this data?
- Mark as New
- Bookmark
- Subscribe
- Mute
- Subscribe to RSS Feed
- Permalink
- Notify Moderator
How can i find the best distribution: weibull or exponential distribution for this data?
Hi everyone
can anyone help me to find the best distribution: weibull or exponential distribution for this data using Mathcad, please?
1.393 0.66 1.032 0.336 1.451 0.489 1.123 1.789 1.542 0.051 1.654 2.813 0.736 0.637 1.477 0.859 2.017 0.391 0.754 0.26 0.127 0.725 0.842 0.28 0.396 0.022 0.623 1.205 0.312 0.986 0.534 2.818 1.184 0.656 0.315 0.806 0.444 0.848 0.443 0.64 0.456 0.678 1.527 0.901 0.758 0.434 1.468 0.795 0.503 1.541
i want the parameters for both of them please
thank for all
Solved! Go to Solution.
- Labels:
-
Statistics_Analysis
Accepted Solutions
- Mark as New
- Bookmark
- Subscribe
- Mute
- Subscribe to RSS Feed
- Permalink
- Notify Moderator
Mohamed Ali wrote:
Hi everyone
can anyone help me to find the best distribution: weibull or exponential distribution for this data using Mathcad, please?
1.393 0.66 1.032 0.336 1.451 0.489 1.123 1.789 1.542 0.051 1.654 2.813 0.736 0.637 1.477 0.859 2.017 0.391 0.754 0.26 0.127 0.725 0.842 0.28 0.396 0.022 0.623 1.205 0.312 0.986 0.534 2.818 1.184 0.656 0.315 0.806 0.444 0.848 0.443 0.64 0.456 0.678 1.527 0.901 0.758 0.434 1.468 0.795 0.503 1.541
i want the parameters for both of them please
thank for all
With so few data points, you could probably(!) fit anything you wanted to it. If you open my worksheet on your other recent thread, you type in your data in place of the test data and see what it looks like. It looks as though the weibull is a better shape than the exponential.
You could use genfit to try and estimate the best fit value for the shape parameter s, but I suspect that you'd be better off adjusting your data to get rid of the large outlier (if that's what it is) in the tail of the distribution; othewise, the shape looks to be a poorer fit to the main part of the histogram.

Stuart
- Mark as New
- Bookmark
- Subscribe
- Mute
- Subscribe to RSS Feed
- Permalink
- Notify Moderator
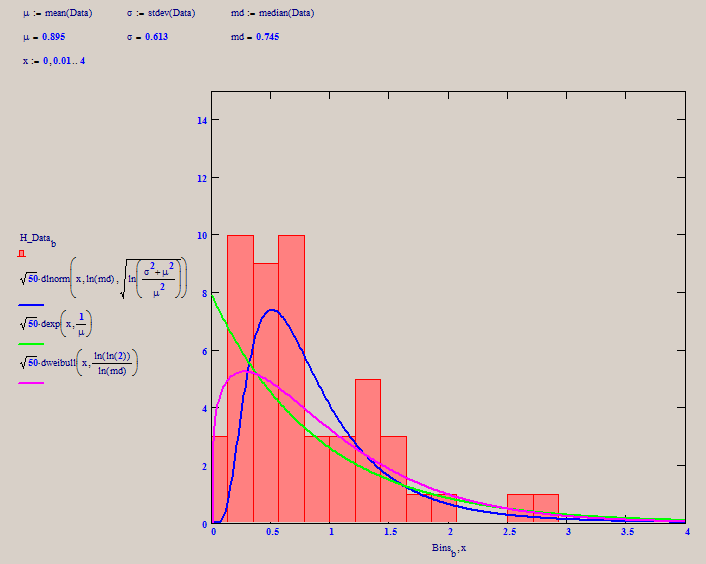
How about this:

I find the best correlation for a lognormal distribution, but one might argue that Weibull fits better.
Success!
Luc
- Mark as New
- Bookmark
- Subscribe
- Mute
- Subscribe to RSS Feed
- Permalink
- Notify Moderator
Mohamed Ali wrote:
Hi everyone
can anyone help me to find the best distribution: weibull or exponential distribution for this data using Mathcad, please?
1.393 0.66 1.032 0.336 1.451 0.489 1.123 1.789 1.542 0.051 1.654 2.813 0.736 0.637 1.477 0.859 2.017 0.391 0.754 0.26 0.127 0.725 0.842 0.28 0.396 0.022 0.623 1.205 0.312 0.986 0.534 2.818 1.184 0.656 0.315 0.806 0.444 0.848 0.443 0.64 0.456 0.678 1.527 0.901 0.758 0.434 1.468 0.795 0.503 1.541
i want the parameters for both of them please
thank for all
With so few data points, you could probably(!) fit anything you wanted to it. If you open my worksheet on your other recent thread, you type in your data in place of the test data and see what it looks like. It looks as though the weibull is a better shape than the exponential.
You could use genfit to try and estimate the best fit value for the shape parameter s, but I suspect that you'd be better off adjusting your data to get rid of the large outlier (if that's what it is) in the tail of the distribution; othewise, the shape looks to be a poorer fit to the main part of the histogram.

Stuart
- Mark as New
- Bookmark
- Subscribe
- Mute
- Subscribe to RSS Feed
- Permalink
- Notify Moderator
Thanks for reply
but how did you graph the dweibull(x,s) although we did not know the value of s ?
- Mark as New
- Bookmark
- Subscribe
- Mute
- Subscribe to RSS Feed
- Permalink
- Notify Moderator
Mohamed Ali wrote:
Thanks for reply
but how did you graph the dweibull(x,s) although we did not know the value of s ?
I just guessed from the look of the curve and chose 2 (or, rather, left it at the value I'd used to generate the dummy test data earlier on in the worksheet). The genfit function should then have improved upon that value.
Stuart
- Mark as New
- Bookmark
- Subscribe
- Mute
- Subscribe to RSS Feed
- Permalink
- Notify Moderator
Thanks for your effort
should you send the full code in mathcad please?
- Mark as New
- Bookmark
- Subscribe
- Mute
- Subscribe to RSS Feed
- Permalink
- Notify Moderator
Mohamed Ali wrote:
Thanks for your effort
should you send the full code in mathcad please?
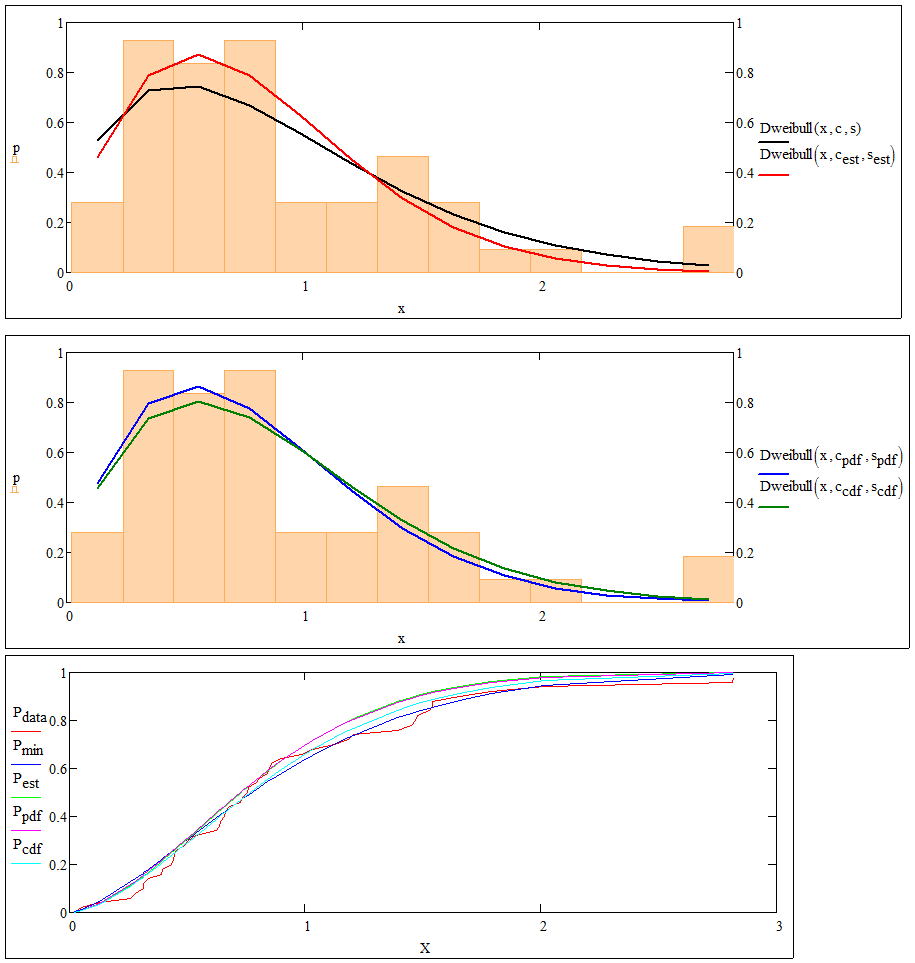
See attached. I wasn't particularly happy with the values that my genfit and solve block models were giving, so I moved to fitting the cumulative distiibution. I then remembered that there had been a flurry of actvity in this subject some time ago, so had a quick search and found some likely looking threads, including this one: Fitting Statistical Distributions, which featured a worksheet with a set of generic fitting functions written by Tom Gutman (one of the Big Names in Mathcad at the time - it's a shame he didn't keep on with this forum).
The worksheet was lost during the migration from the old Mathsoft Collaboratory to the PTC Community, but I have a worksheet of about the right age and description sitting in my library, so I had a quick look at it. Unfortunately, it was written for Mathcad 11 and made use of capabilities that were lost in the transition to Mathcad 12 (and is one of the few areas where Prime offers a signfiicant advantage over Mathcad 12..15). I didn't have the time to sort out a number of static typing issues that cropped up when I tried to generalize the fitting functions, so I've lifted the basic estimation tools and tailored them specifically for the Weibull distribution. It should be a fairly straightforward job to do something similar for the log-normal distribution., so this is left as an exercise for the reader. ![]()
One point of note is that it uses a 2-parameter Weibull distribution, ie shape and scale. I was getting similar results for the cdf fit with Mathcad's 2-parameter Weibull, but the 2-parameter version is more versatile.
Stuart

- Mark as New
- Bookmark
- Subscribe
- Mute
- Subscribe to RSS Feed
- Permalink
- Notify Moderator
Stuart,
Thank you for the worksheets in attachment. It would be great to remake worksheet for Mathcad 15 version for all remaining distributions in the old file.
- Mark as New
- Bookmark
- Subscribe
- Mute
- Subscribe to RSS Feed
- Permalink
- Notify Moderator
VladimirN. wrote:
Stuart,
Thank you for the worksheets in attachment. It would be great to remake worksheet for Mathcad 15 version for all remaining distributions in the old file.
Действительно, было бы, Владимир. I do so love a volunteer. ![]()
I've a feeling that there were M12/M13 ports of this and similar worksheets, but many of them are no longer linked to their threads in the Community. Do the old Collaboratory files still exist somewhere in the PTC Archives?
Unfortunately, I don't have time to do the conversion at the moment but I may have a look sometime.
Stuart
- Mark as New
- Bookmark
- Subscribe
- Mute
- Subscribe to RSS Feed
- Permalink
- Notify Moderator
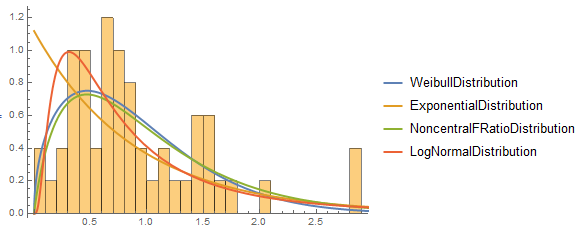
These are just my thoughts.I have a Mathcad 15 but does not work on Windows 8.1.I tried this in the Mathematica software. There is such a function called "DistributionFitTest" calculates the "p" probability and tested whether data is distributed. A small p-value suggests that it is unlikely that the data came from dist.
- WeibullDistribution p = 0.422665.
- ExponentialDistribution p = 0.00122985.
- LogNormalDistribution p = 0.0165806.
- NoncentralFRatioDistribution p = 0.676676.
So "NoncentralFRatioDistribution" fits is best.Of course, I'not checked all distributions , it may be better fit there are so many.


