Community Tip - When posting, your subject should be specific and summarize your question. Here are some additional tips on asking a great question. X
- Subscribe to RSS Feed
- Mark Topic as New
- Mark Topic as Read
- Float this Topic for Current User
- Bookmark
- Subscribe
- Mute
- Printer Friendly Page
How to access interpolated data to use as a variable??
- Mark as New
- Bookmark
- Subscribe
- Mute
- Subscribe to RSS Feed
- Permalink
- Notify Moderator
How to access interpolated data to use as a variable??
See attached Mathcad file and xls file containing data.
I am trying to increase the number of time points in a field vs. time data file to then use in a subsequent calculation with the increased data points. The time points are all less than 1.
I cannot figure out how to access the interpolated data to use in a subsequent calculation involving range variables.
Can the range variable to use as the indices be less than 1? If not, how can this data be used in a time varying calculation?
Thanks for any help.
Reg Curry
Solved! Go to Solution.
- Labels:
-
Statistics_Analysis
Accepted Solutions
- Mark as New
- Bookmark
- Subscribe
- Mute
- Subscribe to RSS Feed
- Permalink
- Notify Moderator
I edited this before it posted; for some reason the edited version did not post. Anyway, I found the answer to my question in an old post via a search of this forum. If, the edited version ever posts, you will see a link to that answer.
- Mark as New
- Bookmark
- Subscribe
- Mute
- Subscribe to RSS Feed
- Permalink
- Notify Moderator
Reg Curry wrote:
See attached Mathcad file and xls file containing data.
No attachment visible!?
If you answer to this and would like to attach files, you first have to click on "Use advanced editor" at the upper right and then you are offered at the lower right the option to attach files.
- Mark as New
- Bookmark
- Subscribe
- Mute
- Subscribe to RSS Feed
- Permalink
- Notify Moderator
I edited this before it posted; for some reason the edited version did not post. Anyway, I found the answer to my question in an old post via a search of this forum. If, the edited version ever posts, you will see a link to that answer.
- Mark as New
- Bookmark
- Subscribe
- Mute
- Subscribe to RSS Feed
- Permalink
- Notify Moderator
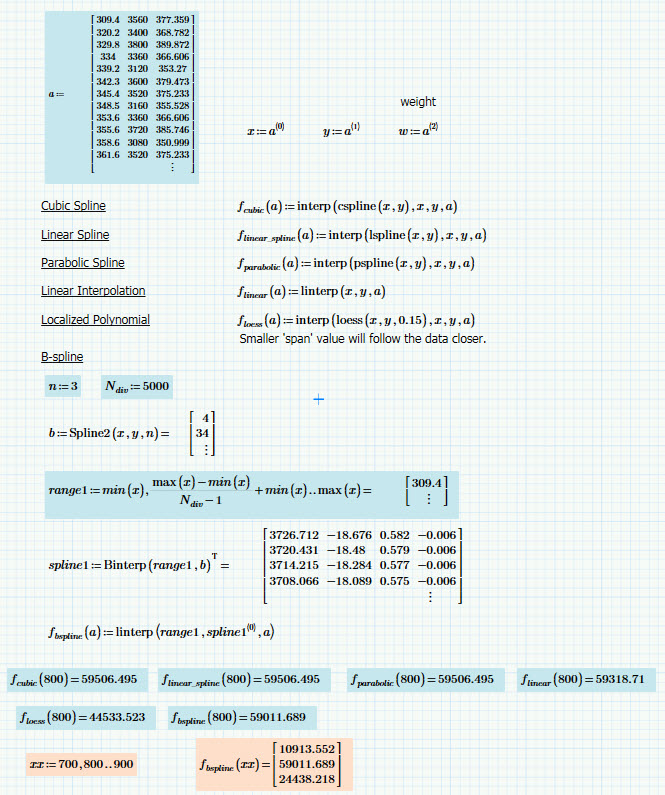
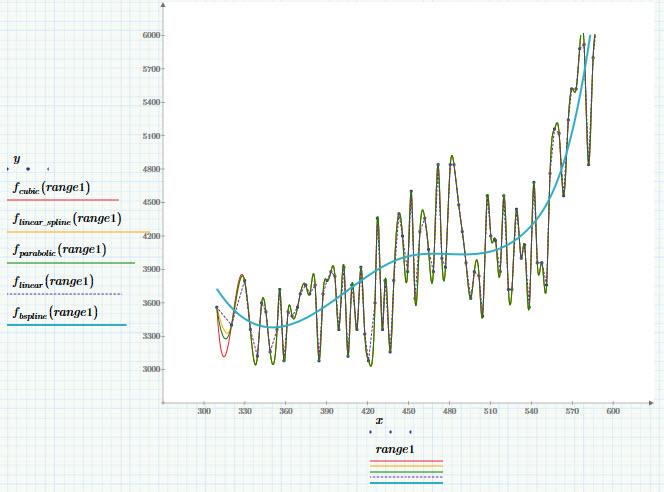
Well, you didn't attach anything, but here's some general interpolation techniques. Be sure to plot your results to be sure the interpolation is what you want. At the very end I calculate results for a range variable.

While more complicated, the B-spline does a nice job of fitting the data.


