Community Tip - Did you get an answer that solved your problem? Please mark it as an Accepted Solution so others with the same problem can find the answer easily. X
- Subscribe to RSS Feed
- Mark Topic as New
- Mark Topic as Read
- Float this Topic for Current User
- Bookmark
- Subscribe
- Mute
- Printer Friendly Page
How to calculate area?!
- Mark as New
- Bookmark
- Subscribe
- Mute
- Subscribe to RSS Feed
- Permalink
- Notify Moderator
How to calculate area?!
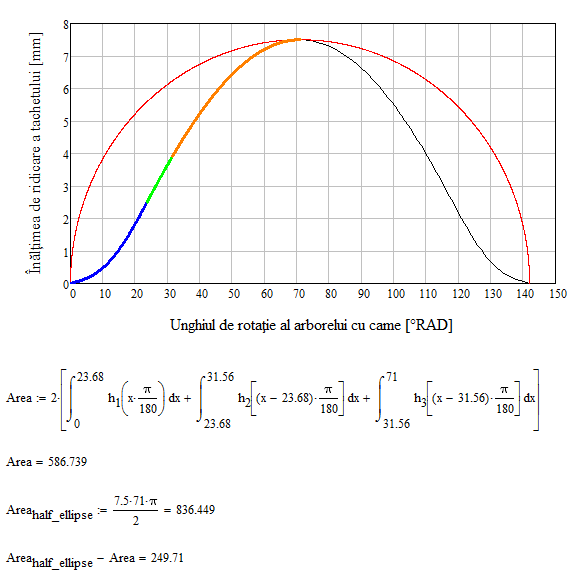
Hello! I have a 2 graphs. I don't know how to calculate the area under the graph. Graph with red is half of a circle, and graph with black is defined by 3 functions. Normally, the graph area with red is higher than the graph area with black. Thank you for help!
Solved! Go to Solution.
- Labels:
-
Other
Accepted Solutions
- Mark as New
- Bookmark
- Subscribe
- Mute
- Subscribe to RSS Feed
- Permalink
- Notify Moderator
As you know where the different segments join and as the curve seems to be symmetrical wrt x071 it should be easy to calculate the area under the black curve using three different integrals.
I am still concerned as of your unit mismatch, but here is a way whoch uses the "units" you provide:

BTW, you talk about the red "half-circle" but is height is 7.5 (whatever unit) and its width is 2*71 (whatever unit).
EDIT: My result differs from Freds because he sticked to the range variables you used for plotting, but I think that those ranges overlap and so I tried to compensate for that. I may be wrong, though, as i am still a bit confused about the complicated and clumsy way you defined and plotted your functions.
Also I assumed symmetry which upon closer inspection seems not to apply. So you would have to a get rid of the front factor 2 and add three more integrals.
- Mark as New
- Bookmark
- Subscribe
- Mute
- Subscribe to RSS Feed
- Permalink
- Notify Moderator
Monte Carlo Method!
- Mark as New
- Bookmark
- Subscribe
- Mute
- Subscribe to RSS Feed
- Permalink
- Notify Moderator
I have a problem with the units in your application
You label the abscissa of your plot as being an angle and obviously (despite of the fact you write °RAD) you mean the angle be measured in degree.
But the absicissa of the red curve (X(...) is of dimensions length, probably unit mm. Thats a discrepancy!
Furthermore, what should the unit of that area you are looking for be? mm^2, degree times mm or simply mm (=radians times mm).
- Mark as New
- Bookmark
- Subscribe
- Mute
- Subscribe to RSS Feed
- Permalink
- Notify Moderator
I forget to say this. Consider Y axis simmilary with X axis. In mm units. Maximum is 7.5 mm like on X Axis. The half of circle will have area 3,14/2 * (7.5)^2. This means 88.312 mm^2. But I don't know how to calculate area for black graph.
- Mark as New
- Bookmark
- Subscribe
- Mute
- Subscribe to RSS Feed
- Permalink
- Notify Moderator
As you know where the different segments join and as the curve seems to be symmetrical wrt x071 it should be easy to calculate the area under the black curve using three different integrals.
I am still concerned as of your unit mismatch, but here is a way whoch uses the "units" you provide:

BTW, you talk about the red "half-circle" but is height is 7.5 (whatever unit) and its width is 2*71 (whatever unit).
EDIT: My result differs from Freds because he sticked to the range variables you used for plotting, but I think that those ranges overlap and so I tried to compensate for that. I may be wrong, though, as i am still a bit confused about the complicated and clumsy way you defined and plotted your functions.
Also I assumed symmetry which upon closer inspection seems not to apply. So you would have to a get rid of the front factor 2 and add three more integrals.
- Mark as New
- Bookmark
- Subscribe
- Mute
- Subscribe to RSS Feed
- Permalink
- Notify Moderator
Thanks! This is graph of lifting height for a cam. 7.5 mm is maximum height and 142 degrees is lifting time measured in camshaft rotation. And elipse is for a ideal cam which have maximum randament.
- Mark as New
- Bookmark
- Subscribe
- Mute
- Subscribe to RSS Feed
- Permalink
- Notify Moderator
You can integrate to find the areas. The curve that's only two functions is easiest:

For the other, you need to either make a single function or do three piecewise integrations.

But I agree with Werner, you're not plotting apples and apples.
- The first (black curve) is plotting length (h) against angle,
- The second curve (red) is plotting Y against X length against length.
- Mark as New
- Bookmark
- Subscribe
- Mute
- Subscribe to RSS Feed
- Permalink
- Notify Moderator
Thanks!


