
Turn on suggestions
Auto-suggest helps you quickly narrow down your search results by suggesting possible matches as you type.
Showing results for
Please log in to access translation
Turn on suggestions
Auto-suggest helps you quickly narrow down your search results by suggesting possible matches as you type.
Showing results for
Community Tip - Need to share some code when posting a question or reply? Make sure to use the "Insert code sample" menu option. Learn more! X
Translate the entire conversation x
Please log in to access translation
Options
- Subscribe to RSS Feed
- Mark Topic as New
- Mark Topic as Read
- Float this Topic for Current User
- Bookmark
- Subscribe
- Mute
- Printer Friendly Page
How to sketch a function F(x,y)
Jun 06, 2013
09:36 AM
- Mark as New
- Bookmark
- Subscribe
- Mute
- Subscribe to RSS Feed
- Permalink
- Notify Moderator
Please log in to access translation
Jun 06, 2013
09:36 AM
How to sketch a function F(x,y)
Hello everyone.
I have to sketch this distribution function, but it always ends with this error:
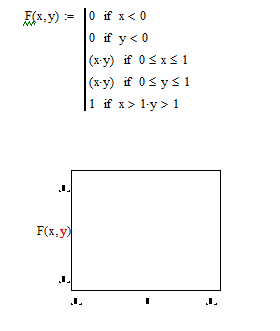
It says that "y" is undefined.
Thanks in advance
Solved! Go to Solution.
Labels:
- Labels:
-
Other
ACCEPTED SOLUTION
Accepted Solutions
Jun 06, 2013
10:38 AM
- Mark as New
- Bookmark
- Subscribe
- Mute
- Subscribe to RSS Feed
- Permalink
- Notify Moderator
Please log in to access translation
Jun 06, 2013
10:38 AM
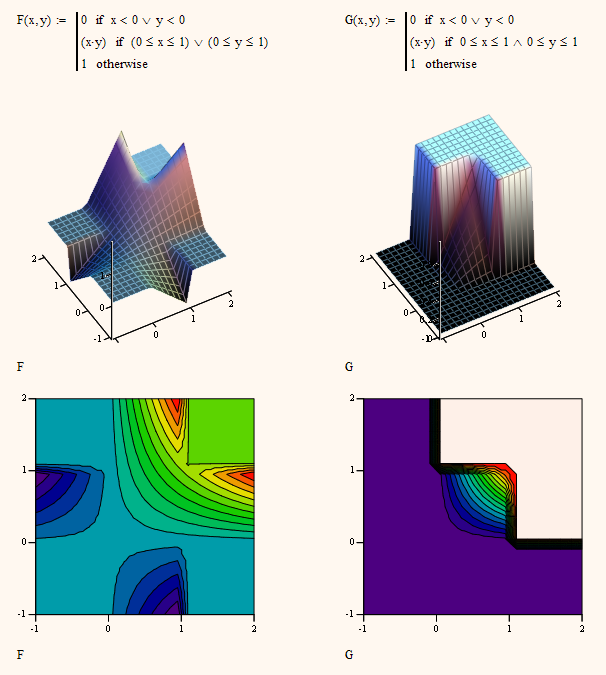
Not sure if your distribution function is defined correctly. Could imagine that you have something like G(x,y) in mind, but then, I may be wrong.
4 REPLIES 4
Jun 06, 2013
10:02 AM
- Mark as New
- Bookmark
- Subscribe
- Mute
- Subscribe to RSS Feed
- Permalink
- Notify Moderator
Please log in to access translation
Jun 06, 2013
10:02 AM
Please attach a worksheet (upper right, "Use advanced editor"),
You have a 3D-function (2 independent x,y, 1 dependent variable F) but try to do a 2D plot - use a surface plot.
Jun 06, 2013
10:21 AM
- Mark as New
- Bookmark
- Subscribe
- Mute
- Subscribe to RSS Feed
- Permalink
- Notify Moderator
Please log in to access translation
Jun 06, 2013
10:21 AM
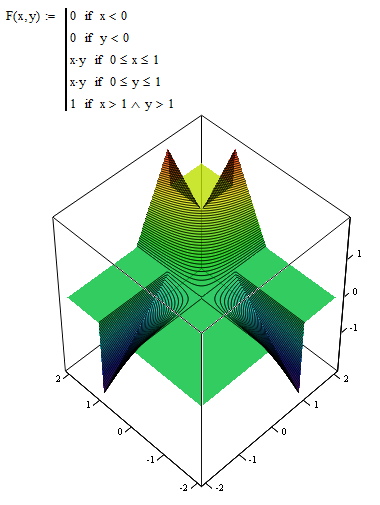
May by so:
Jun 06, 2013
10:38 AM
- Mark as New
- Bookmark
- Subscribe
- Mute
- Subscribe to RSS Feed
- Permalink
- Notify Moderator
Please log in to access translation
Jun 06, 2013
10:38 AM
Not sure if your distribution function is defined correctly. Could imagine that you have something like G(x,y) in mind, but then, I may be wrong.
Jun 06, 2013
11:12 AM
- Mark as New
- Bookmark
- Subscribe
- Mute
- Subscribe to RSS Feed
- Permalink
- Notify Moderator
Please log in to access translation
Jun 06, 2013
11:12 AM
Thanks everyone, especially Werner Exinger


