Community Tip - Visit the PTCooler (the community lounge) to get to know your fellow community members and check out some of Dale's Friday Humor posts! X
- Subscribe to RSS Feed
- Mark Topic as New
- Mark Topic as Read
- Float this Topic for Current User
- Bookmark
- Subscribe
- Mute
- Printer Friendly Page
I can`t plot an ellipse in Mathcad
- Mark as New
- Bookmark
- Subscribe
- Mute
- Subscribe to RSS Feed
- Permalink
- Notify Moderator
I can`t plot an ellipse in Mathcad
I do not know what I do wrong in sample. I can't plot graphs.
- Mark as New
- Bookmark
- Subscribe
- Mute
- Subscribe to RSS Feed
- Permalink
- Notify Moderator
k.x:=??
- Mark as New
- Bookmark
- Subscribe
- Mute
- Subscribe to RSS Feed
- Permalink
- Notify Moderator
@ptc-3682623 wrote:
I do not know what I do wrong in sample. I can't plot graphs.
How can you expect a plot without providing any values??
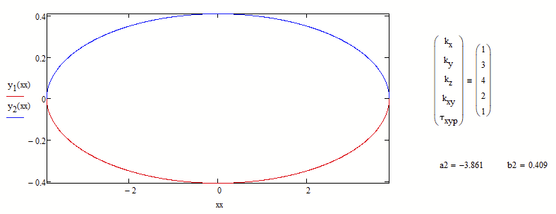
Here is a simple fix by providing the necessary values via a global assignment. What did you mean with the second argument 0.1 you wrote for the functions y1,y2?
You may also consider turning all your variables in functions of the five input parameters. It may be necessary to uses the "assume" statement in the symbolic evaluations to tell Mathcad which parameters are real, positive, greater than the other, etc. The symbolic results may be quite too large for Mathcad being willing to display. Not sure if you really need symbolic results anyway.
Mathcad15 worksheet attached
- Mark as New
- Bookmark
- Subscribe
- Mute
- Subscribe to RSS Feed
- Permalink
- Notify Moderator
Not allowed to edit the post I just made, so the remark here in a follow up.
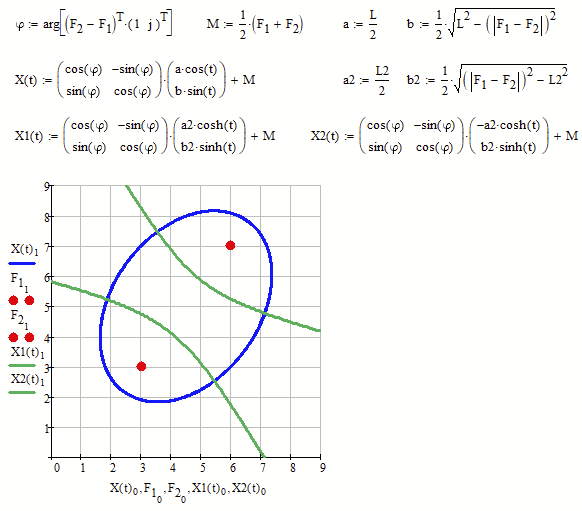
If the goal is just to plot the ellipse, a parametric representation might be more appropriate:
(The absolute values aren't strictly necessary)
- Mark as New
- Bookmark
- Subscribe
- Mute
- Subscribe to RSS Feed
- Permalink
- Notify Moderator
- Mark as New
- Bookmark
- Subscribe
- Mute
- Subscribe to RSS Feed
- Permalink
- Notify Moderator
- Mark as New
- Bookmark
- Subscribe
- Mute
- Subscribe to RSS Feed
- Permalink
- Notify Moderator
- Mark as New
- Bookmark
- Subscribe
- Mute
- Subscribe to RSS Feed
- Permalink
- Notify Moderator
I may be blind but as far as I can see your three answers don't take into account the questioner's file and his question about it? They were just triggered by the subject "plot an ellipse", right? 🙂
As far as your plotting of implicit functions concerns I strongly would suggest to use Viacheslav N. Mezentsev's function "implicitplot2d" - it usually gives a better result much faster.
See her the use for your example of an ellipse and a hyperbola:
P.S.: Of course you don't need implicit plots at all for conic sections (ellipse, hyperbola, parabola) as you always can find a parametric representation to plot it directly.
- Mark as New
- Bookmark
- Subscribe
- Mute
- Subscribe to RSS Feed
- Permalink
- Notify Moderator
Afterthought
Here is what I was talking about when I wrote that you can always find a parametric representation for a quadric (conic section):
Mathcad 15 worksheet attached
- Mark as New
- Bookmark
- Subscribe
- Mute
- Subscribe to RSS Feed
- Permalink
- Notify Moderator
OK! But!
1. We MUST use units in this problem. It is modern standard!
2. KISS - Keep it simple, stupid!
3. Can you solve with Мезенцев tools this problem?
- Mark as New
- Bookmark
- Subscribe
- Mute
- Subscribe to RSS Feed
- Permalink
- Notify Moderator
@ValeryOchkov wrote:
OK! But!
1. We MUST use units in this problem.
Sure not. What we have to do is respond to the questioner's specific question and answer it as best as possible. Otherwise this forum would be relatively meaningless IMHO.
- Mark as New
- Bookmark
- Subscribe
- Mute
- Subscribe to RSS Feed
- Permalink
- Notify Moderator
@ValeryOchkov wrote:
OK! But!
3. Can you solve with Мезенцев tools this problem?
You can do it like this
- Mark as New
- Bookmark
- Subscribe
- Mute
- Subscribe to RSS Feed
- Permalink
- Notify Moderator
- Mark as New
- Bookmark
- Subscribe
- Mute
- Subscribe to RSS Feed
- Permalink
- Notify Moderator
@ptc-3682623 wrote:
The same problem. Sample in attachment.
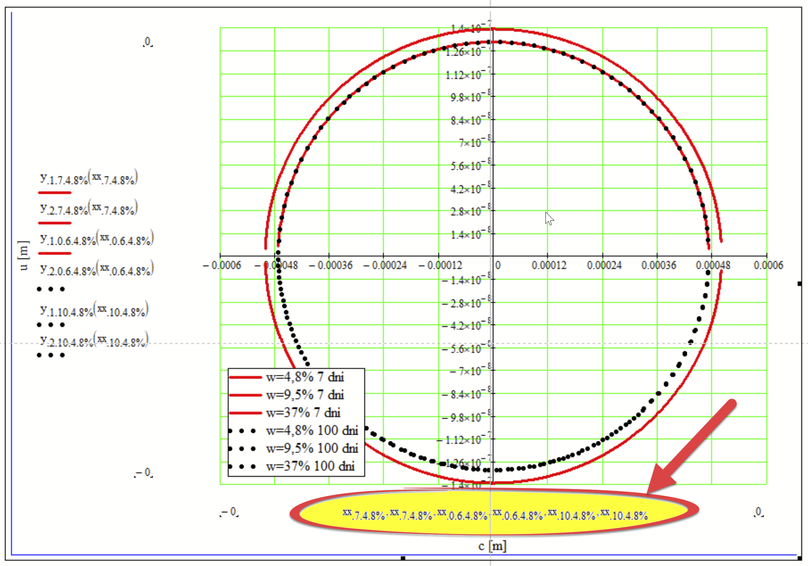
No, its not the same problem! The entries on the abscissa and the ordinate must correspond. If there are less entries on the abscissa, the existing ones are matched with those on the ordinate and the rest of the ordinate entries are matched with the last entry on the abscissa.
You should also change the number format, otherwise you would see just zeros at the ordinate. Alternatively it might be better to multiply the values by 10^9 tp represent nm instead of m. You know you can work with units in Mathcad from the start? Its a valuable feature you sure should try.
- Mark as New
- Bookmark
- Subscribe
- Mute
- Subscribe to RSS Feed
- Permalink
- Notify Moderator
Now is something wrong too. If I put more points I got error like in sample. We need put more points like in sample4. It will be 6 more points like in sample4.
- Mark as New
- Bookmark
- Subscribe
- Mute
- Subscribe to RSS Feed
- Permalink
- Notify Moderator
The error message says it all. The total number in one plot region is limited to 500000 in Mathcad (the help states erroneously 150000 which was the limit in earlier versions of Mathcad) .
So you must reduce the number of values in the various range variables you are using for plotting.
I just had a look at the range xx.10.9.5% which you defined. This range variable has 40386 values and so the two plots which use this range consist of nearly 81000 points. Some other ranges you use seem to have even more values and so the twelve plots you try to show in this last regions exceed the total limit of half a million points.
So change the 10^-6 in the definition of your ranges to a larger value - 10^-5 will do, 10^-4 will be even better and will also speed up editing and scrolling your sheet.
If you don't like the gaps in the ellipses at the left and right ends, you'll have to plot the ellipses uses their parameter representation as I had shown a while ago in a previous answer.


