
Turn on suggestions
Auto-suggest helps you quickly narrow down your search results by suggesting possible matches as you type.
Showing results for
Please log in to access translation
Turn on suggestions
Auto-suggest helps you quickly narrow down your search results by suggesting possible matches as you type.
Showing results for
Community Tip - When posting, your subject should be specific and summarize your question. Here are some additional tips on asking a great question. X
Translate the entire conversation x
Please log in to access translation
Options
- Subscribe to RSS Feed
- Mark Topic as New
- Mark Topic as Read
- Float this Topic for Current User
- Bookmark
- Subscribe
- Mute
- Printer Friendly Page
Label inside a 2D plot
Mar 20, 2014
06:33 AM
- Mark as New
- Bookmark
- Subscribe
- Mute
- Subscribe to RSS Feed
- Permalink
- Notify Moderator
Please log in to access translation
Mar 20, 2014
06:33 AM
Label inside a 2D plot
Hi all,
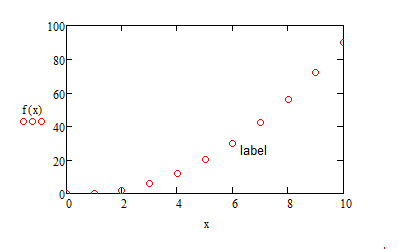
I use MC15 and my question is "how you can write a label/tag near a specific point on a graph".
Example: I have a function f(x) and I want to write something near the point f(x=26).
Regards
Solved! Go to Solution.
ACCEPTED SOLUTION
Accepted Solutions
Mar 20, 2014
06:46 AM
- Mark as New
- Bookmark
- Subscribe
- Mute
- Subscribe to RSS Feed
- Permalink
- Notify Moderator
Please log in to access translation
Mar 20, 2014
06:46 AM
You can do it (in a rather unsatisfactory manner) by writing your label in a text box and then dragging this onto the graph, as has been done in the image below. You can't get Mathcad to label points automatically though.
Alan
5 REPLIES 5
Mar 20, 2014
06:46 AM
- Mark as New
- Bookmark
- Subscribe
- Mute
- Subscribe to RSS Feed
- Permalink
- Notify Moderator
Please log in to access translation
Mar 20, 2014
06:46 AM
You can do it (in a rather unsatisfactory manner) by writing your label in a text box and then dragging this onto the graph, as has been done in the image below. You can't get Mathcad to label points automatically though.
Alan
Mar 20, 2014
07:01 AM
- Mark as New
- Bookmark
- Subscribe
- Mute
- Subscribe to RSS Feed
- Permalink
- Notify Moderator
Please log in to access translation
Mar 20, 2014
07:01 AM
You can insert an EXCEL component into version 15, pass data to it and create the graph in EXCEL (which gives more graphing flexibility.
Mar 20, 2014
07:10 AM
- Mark as New
- Bookmark
- Subscribe
- Mute
- Subscribe to RSS Feed
- Permalink
- Notify Moderator
Please log in to access translation
Mar 20, 2014
07:10 AM
Do you know if this is possible on MathCad Prime 1,2,3 ?
Mar 20, 2014
11:03 AM
- Mark as New
- Bookmark
- Subscribe
- Mute
- Subscribe to RSS Feed
- Permalink
- Notify Moderator
Please log in to access translation
Mar 20, 2014
11:03 AM
Giulio Fraulini wrote:
Do you know if this is possible on MathCad Prime 1,2,3 ?
No, in Prime you don't even have the ability to add a plot title, axis labels or a legend. You are supposed to use text boxes even for those things.
Mar 20, 2014
07:28 AM
- Mark as New
- Bookmark
- Subscribe
- Mute
- Subscribe to RSS Feed
- Permalink
- Notify Moderator
Please log in to access translation
Mar 20, 2014
07:28 AM
Another possibility is to use the Amazing Images eBook routines. See thread http://communities.ptc.com/community/mathcad/mathcad-usage/blog/2010/05/27/creating-amazing-images-with-mathcad-14 for details on downloading


