
Turn on suggestions
Auto-suggest helps you quickly narrow down your search results by suggesting possible matches as you type.
Showing results for
Please log in to access translation
Turn on suggestions
Auto-suggest helps you quickly narrow down your search results by suggesting possible matches as you type.
Showing results for
Community Tip - Did you get called away in the middle of writing a post? Don't worry you can find your unfinished post later in the Drafts section of your profile page. X
Translate the entire conversation x
Please log in to access translation
Options
- Subscribe to RSS Feed
- Mark Topic as New
- Mark Topic as Read
- Float this Topic for Current User
- Bookmark
- Subscribe
- Mute
- Printer Friendly Page
Linear Algebra programming
Jan 04, 2013
12:42 PM
- Mark as New
- Bookmark
- Subscribe
- Mute
- Subscribe to RSS Feed
- Permalink
- Notify Moderator
Please log in to access translation
Jan 04, 2013
12:42 PM
Linear Algebra programming
For linear algebra most students find it very difficult to "visualize" three or more variables. It is so much easier to understand the solution set and linear dependence on a simple xy coordinate plane. For three variables, most college algebra books include pictures and graphs of lines and planes in 3d space. I have found it very difficult to make a graph of lines in 3d space on mathcad. They are asking for constraints and I can not simply define an function of three ordered pairs and point and click my way to a graph. The only example that even comes close (in the mathcad rescource center) is a graph of a helix. That is far to difficult for me. Can any one show an example of three lines in an xyz 3d plot?
Solved! Go to Solution.
ACCEPTED SOLUTION
Accepted Solutions
Jan 05, 2013
01:17 PM
- Mark as New
- Bookmark
- Subscribe
- Mute
- Subscribe to RSS Feed
- Permalink
- Notify Moderator
Please log in to access translation
Jan 05, 2013
01:17 PM
roger wells schrieb:
Valery and Werner . . .thankyou for these examples. I see now that I have considered a function like f(x) to be the same as f(x,y) when in fact one is a curve and the other is a surface (or plane). If I want lines then I am going to need to do some review of vectors and the calculus of space geometry.
That sure would help 😉
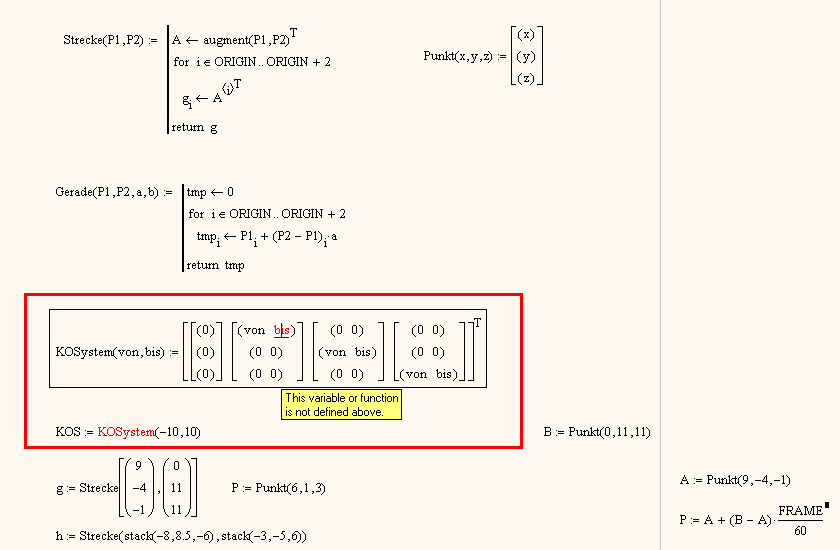
A straight line in 3D can either be described by a parametric representation (like the helix, you mentioned) or via a system of two linear equations in x,y and z (that is a the intersection of two planes).
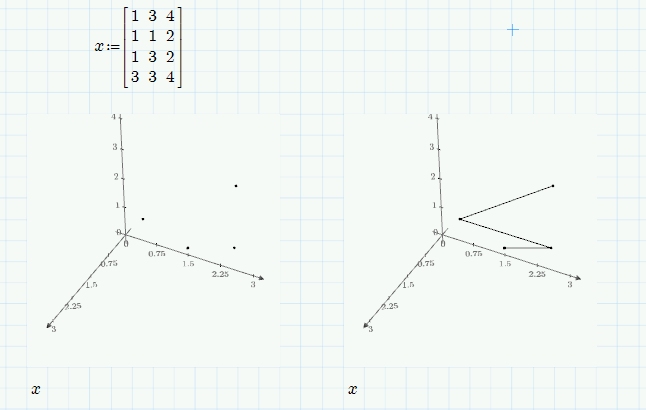
In the attached file I've tried to make it easier to deal with points, line segments and straight lines in Mathcads 3D graph. 3D graph is able to plot points and you may chose that you want it to connct it with lines. This is what my function "Strecke" does - you call it with two vectors (representing the two endpoints of the line segment) as parameters and it returns an expression which you can put in the placeholder of a 3D-graph and you should see a line segment. Unfortunately you will have to format the graph (data point, check chekbox lines, otherwise you will only see the two small points). In the attached file I have added a function for a "real" infinite straight line. This has to be formated as surface plot, not Data points.
But to be honest, Mathcads 3D functionality is not really top notch for your purpose.
I have saved the file in Mathcad 11 format, but I doubt that your Mathcad 2000 will be able to read it.
If you think that a screenshot of the functions or a pdf printout will help, give me a shout.
21 REPLIES 21
Jan 04, 2013
01:36 PM
- Mark as New
- Bookmark
- Subscribe
- Mute
- Subscribe to RSS Feed
- Permalink
- Notify Moderator
Please log in to access translation
Jan 04, 2013
01:36 PM
Put the points you want into a matrix with three columns (for x, y, and z points). Plot it on a 3D plot. By default, you will get points. If you want a line, under the Plots tab, pick Styles, choose your Line Style to include a line. Default will be (none). Is this what you mean?
Jan 04, 2013
01:46 PM
- Mark as New
- Bookmark
- Subscribe
- Mute
- Subscribe to RSS Feed
- Permalink
- Notify Moderator
Please log in to access translation
Jan 04, 2013
01:46 PM
Thankyou, I am on a library computer so will have to go home and investigate this.
Jan 04, 2013
07:34 PM
- Mark as New
- Bookmark
- Subscribe
- Mute
- Subscribe to RSS Feed
- Permalink
- Notify Moderator
Please log in to access translation
Jan 04, 2013
07:34 PM
Thats Prime? Behaviour is different in MC15
Jan 04, 2013
03:33 PM
- Mark as New
- Bookmark
- Subscribe
- Mute
- Subscribe to RSS Feed
- Permalink
- Notify Moderator
Please log in to access translation
Jan 05, 2013
12:35 PM
- Mark as New
- Bookmark
- Subscribe
- Mute
- Subscribe to RSS Feed
- Permalink
- Notify Moderator
Please log in to access translation
Jan 05, 2013
12:35 PM
Jan thankyou but I am not able to open a mcd document on library computers. I only have mathcad professional 2000 and no internet, which pretty much sucks.
Jan 05, 2013
04:26 PM
- Mark as New
- Bookmark
- Subscribe
- Mute
- Subscribe to RSS Feed
- Permalink
- Notify Moderator
Please log in to access translation
Jan 05, 2013
04:26 PM
I converted this files to Mathcad 2000 version. Please see attachment.
Jan 05, 2013
01:37 AM
- Mark as New
- Bookmark
- Subscribe
- Mute
- Subscribe to RSS Feed
- Permalink
- Notify Moderator
Please log in to access translation
Jan 05, 2013
01:37 AM
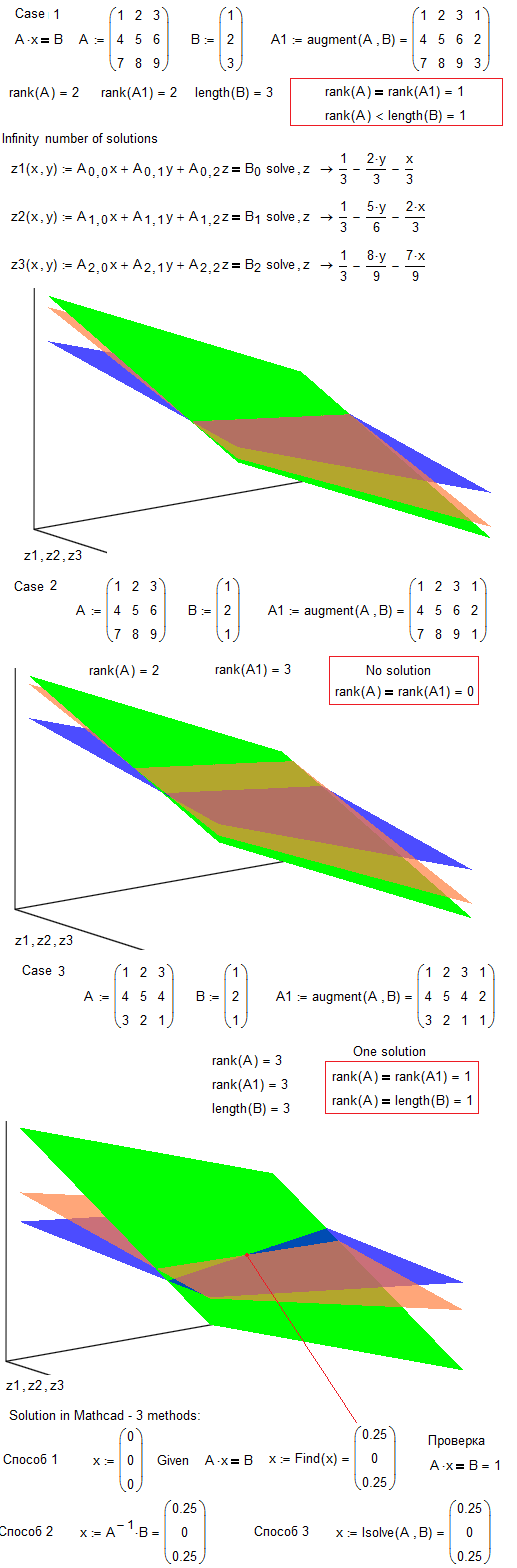
One Mathcad illustration of the main linear algebra theorem (from Wikipedia).
Rouché–Capelli theorem is the theorem in linear algebra that allows computing the number of solutions in a system of linear equations given the ranks of its augmented matrix and coefficient matrix. The theorem is known as Kronecker–Capelli theorem in Russia, Rouché–Capelli theorem in Italy, Rouché–Fontené theorem in France and Rouché–Frobenius theorem in Spain and many countries in Latin America.
A system of linear equations with  variables has a solution if and only if the rank of its coefficient matrix A is equal to the rank of its augmented matrix [A|b]. If there are solutions, they form an affine subspace of
  of dimension n − rank(A). In particular:
- if n = rank(A), the solution is unique,
- otherwise there are infinite number of solutions.
Jan 05, 2013
12:31 PM
- Mark as New
- Bookmark
- Subscribe
- Mute
- Subscribe to RSS Feed
- Permalink
- Notify Moderator
Please log in to access translation
Jan 05, 2013
12:31 PM
Valery and Werner . . .thankyou for these examples. I see now that I have considered a function like f(x) to be the same as f(x,y) when in fact one is a curve and the other is a surface (or plane). If I want lines then I am going to need to do some review of vectors and the calculus of space geometry.
Jan 05, 2013
01:17 PM
- Mark as New
- Bookmark
- Subscribe
- Mute
- Subscribe to RSS Feed
- Permalink
- Notify Moderator
Please log in to access translation
Jan 05, 2013
01:17 PM
roger wells schrieb:
Valery and Werner . . .thankyou for these examples. I see now that I have considered a function like f(x) to be the same as f(x,y) when in fact one is a curve and the other is a surface (or plane). If I want lines then I am going to need to do some review of vectors and the calculus of space geometry.
That sure would help 😉
A straight line in 3D can either be described by a parametric representation (like the helix, you mentioned) or via a system of two linear equations in x,y and z (that is a the intersection of two planes).
In the attached file I've tried to make it easier to deal with points, line segments and straight lines in Mathcads 3D graph. 3D graph is able to plot points and you may chose that you want it to connct it with lines. This is what my function "Strecke" does - you call it with two vectors (representing the two endpoints of the line segment) as parameters and it returns an expression which you can put in the placeholder of a 3D-graph and you should see a line segment. Unfortunately you will have to format the graph (data point, check chekbox lines, otherwise you will only see the two small points). In the attached file I have added a function for a "real" infinite straight line. This has to be formated as surface plot, not Data points.
But to be honest, Mathcads 3D functionality is not really top notch for your purpose.
I have saved the file in Mathcad 11 format, but I doubt that your Mathcad 2000 will be able to read it.
If you think that a screenshot of the functions or a pdf printout will help, give me a shout.
Jan 05, 2013
04:45 PM
- Mark as New
- Bookmark
- Subscribe
- Mute
- Subscribe to RSS Feed
- Permalink
- Notify Moderator
Please log in to access translation
Jan 05, 2013
04:45 PM
Werner Exinger wrote:
...I have saved the file in Mathcad 11 format, but I doubt that your Mathcad 2000 will be able to read it...
Werner,
It seems that when converting a file from Mathcad 15 to Mathcad 11 there is some error occurs when I opened this file in MC11. But I corrected it. Worksheet for Mathcad 2000 version can be found in attachment.
Jan 06, 2013
05:28 PM
- Mark as New
- Bookmark
- Subscribe
- Mute
- Subscribe to RSS Feed
- Permalink
- Notify Moderator
Please log in to access translation
Jan 06, 2013
05:28 PM
Thanks!
Cannot explain that behaviour of MC 11. I liked MC 11 a lot (mainly because of Maple, of course), but meanwhile I haven't it installed anymore. Maybe some day I manage to put it in a virtual machine, but I guess I will get into troubles with the license file. After all the license server of mathsoft is history.
Jan 07, 2013
10:08 AM
- Mark as New
- Bookmark
- Subscribe
- Mute
- Subscribe to RSS Feed
- Permalink
- Notify Moderator
Please log in to access translation
Jan 07, 2013
10:08 AM
No problem.
Jan 05, 2013
08:29 AM
- Mark as New
- Bookmark
- Subscribe
- Mute
- Subscribe to RSS Feed
- Permalink
- Notify Moderator
Please log in to access translation
Jan 05, 2013
08:29 AM
Valery has shown how to graph planes, but as you asked for lines in 3D space i thought the attached would help.
Unfortunately the formatting (checkbox "lines" is not activated on default, etc.) cannot be done parameter driven but has to done manually.
You did not specify if you are interested in Mathcad15 or Mathcad Prime. The attched information is for Mathcad 15.

Jan 05, 2013
11:12 AM
- Mark as New
- Bookmark
- Subscribe
- Mute
- Subscribe to RSS Feed
- Permalink
- Notify Moderator
Please log in to access translation
Jan 05, 2013
11:12 AM
H264 encoding animations give better results and a video file is 16 times less.With the same quality.Upload is very fast.
Jan 05, 2013
11:22 AM
- Mark as New
- Bookmark
- Subscribe
- Mute
- Subscribe to RSS Feed
- Permalink
- Notify Moderator
Please log in to access translation
Jan 05, 2013
11:22 AM
Better to use PlanetPTC Video for animation - http://communities.ptc.com/community/mathcad?view=video
Jan 07, 2013
11:33 AM
- Mark as New
- Bookmark
- Subscribe
- Mute
- Subscribe to RSS Feed
- Permalink
- Notify Moderator
Please log in to access translation
Jan 07, 2013
11:33 AM
Valery Ochkov schrieb:
Better to use PlanetPTC Video for animation - http://communities.ptc.com/community/mathcad?view=video
That place looks like it is intended for "showing off", or, friendly speaking, its for animations (hopefully along with documentation/worksheet) which are of more general interest.
The animation I posted does not fall into this catagory, I think. It belongs to this thread only.
My failure that I hadn't tried to damp it in size.
Jan 05, 2013
11:33 AM
- Mark as New
- Bookmark
- Subscribe
- Mute
- Subscribe to RSS Feed
- Permalink
- Notify Moderator
Please log in to access translation
Jan 05, 2013
11:33 AM
Jan Kowalski schrieb:
H264 encoding animations give better results and a video file is 16 times less.With the same quality.Upload is very fast.
Sorry, but H264 seems not to be installed on my machine - at least there no option to chose. From the list of available codecs MicrosofVideo1 was the only which give not an error (can not initialize videostream). Guess these are installed decoders and not encoders.
Jan 05, 2013
04:53 PM
- Mark as New
- Bookmark
- Subscribe
- Mute
- Subscribe to RSS Feed
- Permalink
- Notify Moderator
Please log in to access translation
Jan 05, 2013
04:53 PM
You can install "K-Lite Codec Pack" (http://codecguide.com/download_k-lite_codec_pack_full.htm) for example to view this animation.
Jan 06, 2013
05:24 PM
- Mark as New
- Bookmark
- Subscribe
- Mute
- Subscribe to RSS Feed
- Permalink
- Notify Moderator
Please log in to access translation
Jan 06, 2013
05:24 PM
K-Lite is installed, but not an recent version. Would Mathcad offer H264 in options when doing an animation if I would install the current version? Or will I have to convert the avi-file later in a second step?
I tried with a freeware H264 encoder to convert the avi-file which is produces by Mathcad and the MicrosoftVideo1 codec - result was really small but faulty. Media Player Classic could showed garbage. At least when I chose to let the resolution as it is. By chosing HD resolution the file was bigger but OK. Because of the altert ratio the picture was distorted.
WE
Jan 06, 2013
06:07 PM
- Mark as New
- Bookmark
- Subscribe
- Mute
- Subscribe to RSS Feed
- Permalink
- Notify Moderator
Please log in to access translation
Jan 06, 2013
06:07 PM
"Would Mathcad offer H264 in options when doing an animation if I would install the current version?" ->NO
"Or will I have to convert the avi-file later in a second step?" -> YES
I did that.I have used the program.Freemake Video Conwerter is free and best.
Jan 06, 2013
06:15 PM
- Mark as New
- Bookmark
- Subscribe
- Mute
- Subscribe to RSS Feed
- Permalink
- Notify Moderator
Please log in to access translation
Jan 06, 2013
06:15 PM
Jan Kowalski schrieb:
"Would Mathcad offer H264 in options when doing an animation if I would install the current version?" ->NO
"Or will I have to convert the avi-file later in a second step?" -> YES
I did that.I have used the program.Freemake Video Conwerter is free and best.
Thanks, I'll give it a try. Although the main reason, the video was as big, was, that Mathcad somehow was set to "every frame should be a keyframe".


