
Turn on suggestions
Auto-suggest helps you quickly narrow down your search results by suggesting possible matches as you type.
Showing results for
Please log in to access translation
Turn on suggestions
Auto-suggest helps you quickly narrow down your search results by suggesting possible matches as you type.
Showing results for
Community Tip - Did you get an answer that solved your problem? Please mark it as an Accepted Solution so others with the same problem can find the answer easily. X
Translate the entire conversation x
Please log in to access translation
Options
- Subscribe to RSS Feed
- Mark Topic as New
- Mark Topic as Read
- Float this Topic for Current User
- Bookmark
- Subscribe
- Mute
- Printer Friendly Page
M14; 2D plot for 2 variable function - one variable constant
Apr 03, 2013
01:28 PM
- Mark as New
- Bookmark
- Subscribe
- Mute
- Subscribe to RSS Feed
- Permalink
- Notify Moderator
Please log in to access translation
Apr 03, 2013
01:28 PM
M14; 2D plot for 2 variable function - one variable constant
Hi All,
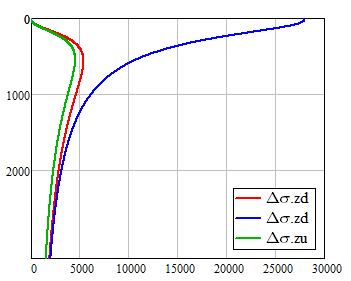
I have a stress equation that is a function of both X and Z (horizontal distance and depth).
I want to produce a 2D plot of this function with a constant X and a variable Z. When I use the 2D plot and input the range variable 'z' on the vertical axis and stress(100,z) it does not give me the correct results.
Any ideas?
Solved! Go to Solution.
ACCEPTED SOLUTION
Accepted Solutions
Apr 03, 2013
02:10 PM
- Mark as New
- Bookmark
- Subscribe
- Mute
- Subscribe to RSS Feed
- Permalink
- Notify Moderator
Please log in to access translation
Apr 03, 2013
02:10 PM
z is NOT a range variable in your sheet!
Mathcads quickplot feature would work only for an undefined variable at the abscissa, not the ordinate.
So if you want the independent variable z at the ordinate, you have to define a range variable for z to make it work.
2 REPLIES 2
Apr 03, 2013
02:10 PM
- Mark as New
- Bookmark
- Subscribe
- Mute
- Subscribe to RSS Feed
- Permalink
- Notify Moderator
Please log in to access translation
Apr 03, 2013
02:10 PM
z is NOT a range variable in your sheet!
Mathcads quickplot feature would work only for an undefined variable at the abscissa, not the ordinate.
So if you want the independent variable z at the ordinate, you have to define a range variable for z to make it work.
Apr 03, 2013
02:27 PM
- Mark as New
- Bookmark
- Subscribe
- Mute
- Subscribe to RSS Feed
- Permalink
- Notify Moderator
Please log in to access translation
Apr 03, 2013
02:27 PM
Thanks! I knew it was something simple. Much appreciated.


