Community Tip - You can change your system assigned username to something more personal in your community settings. X
- Subscribe to RSS Feed
- Mark Topic as New
- Mark Topic as Read
- Float this Topic for Current User
- Bookmark
- Subscribe
- Mute
- Printer Friendly Page
Mathcad 15 - Problem with Modelling I-V characteristic of Solar PV cell
- Mark as New
- Bookmark
- Subscribe
- Mute
- Subscribe to RSS Feed
- Permalink
- Notify Moderator
Mathcad 15 - Problem with Modelling I-V characteristic of Solar PV cell
Using the root function, I have plotted a graph to show the I-V characteristic of a PV cell which is characterised by the implicit equation:
I=Iph-Io [exp((q(V+IRs))/akT)-1]- (V+IRs)/Rsh
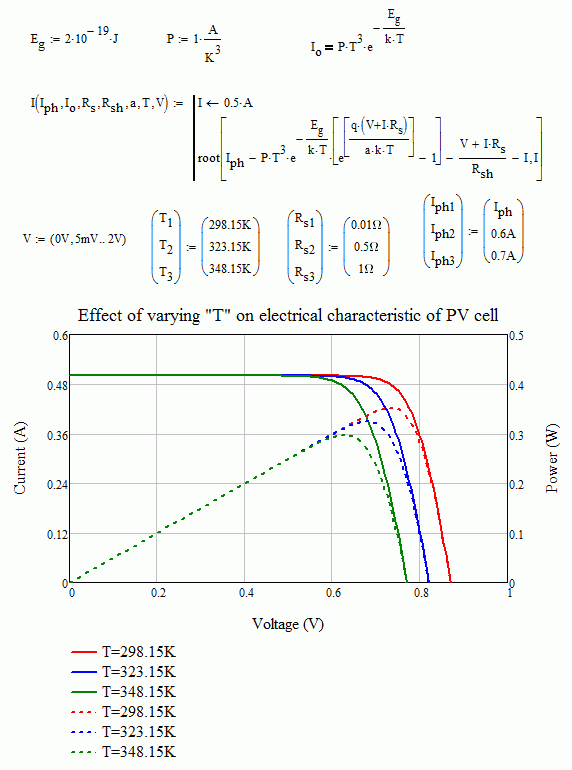
Varying any of the parameters within the equation is expected to affect the I-V characteristic in a particular way. The plotted graphs takes on the expected shape but when I try to change the value of temperature, the plot shifts in an unexpected direction. Increasing temperature should lead to a decrease in open-circuit voltage and thus decrease in output power, but the model I've plotted suggests the opposite i.e. an increase in temperature leads to an increase in open circuit voltage which contravenes PV theory. Short circuit current (current when V=0) has a (slight) positive temperature coefficient while open circuit voltage (voltage when I=0) has a negative temperature coefficient.
In contrast, when I vary other parameters like , Iph, Io , Rsh and Rs, the results are consistent with PV theory e.g. increase in Iph leads to an increase in short circuit current and an increase in output power as expected from PV theory.
Please advise on how I can correct the model to be fully consistent with PV theory. I'm relatively new to Mathcad and I urgently need to resolve this problem for a paper I'm working on.
Please see attached worksheet.
Mike Armstrong, Valery Ochkov, Richard Jackson, AlanStevens (I've tagged you because I've seen your posts all over the community pages... I hope you can help... that's not to deter any other contributors though! ![]() )
)
- Mark as New
- Bookmark
- Subscribe
- Mute
- Subscribe to RSS Feed
- Permalink
- Notify Moderator
Hi.
Your model seems to be ok, but I guess that the problem is that you take Io, the diode saturation current, as constant, which isn't the case, and vary also with the temperature, which make it less efficient for increasing temperatures, where "it" actually isn't the "diode", it is the PV by itself. PV makers give parameters and models for the Isat or Io in your notation. For the others plots, Io is constant.
Best regards.
Alvaro.

- Mark as New
- Bookmark
- Subscribe
- Mute
- Subscribe to RSS Feed
- Permalink
- Notify Moderator
AlvaroDíaz thank you for your response; that does produce the desired shift in the curves. I would like to improve the model a bit by incorporating temperature dependency of Iph and Io . I think I may need to define Iph and Io as functions of temperature but so far my attempts have not been successful resulting in problematic curves as before; it seems only the initially set values of Iph and Io are used in evaluating "I" in the worksheet I've created. Can you advise on how to ammend it so that when the value of T is changed, Iph and Io are evaluated before solving for "I"?
- Mark as New
- Bookmark
- Subscribe
- Mute
- Subscribe to RSS Feed
- Permalink
- Notify Moderator
- Mark as New
- Bookmark
- Subscribe
- Mute
- Subscribe to RSS Feed
- Permalink
- Notify Moderator
Hi. Maybe something like these.
Best regards.
Alvaro.
- Mark as New
- Bookmark
- Subscribe
- Mute
- Subscribe to RSS Feed
- Permalink
- Notify Moderator
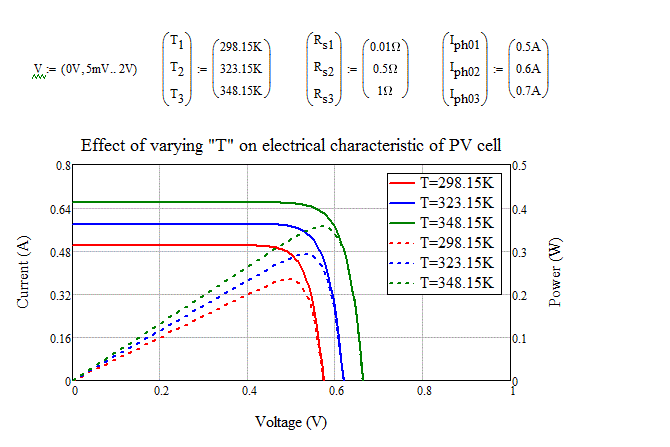
AlvaroDíaz in the new worksheet the temperature dependence of Iph and Io is still not properly reflected as the graph showing effect of temperature variation illustrates the previous contrary behaviour of increasing power output with increase in temperature instead of decrease in output power with temperature increase. Also, in the new worksheet, the reference values with additional subscript "0" (i.e. Iph0, Io0, a0 ,Rsh0 and Rs0) are all constants, only the variables without the additional subscript "0" are variable as they are temperature dependent. The graph showing the effect of varying is also not quite accurate since the value Iph0 of is being varied instead of varying Iph
- Mark as New
- Bookmark
- Subscribe
- Mute
- Subscribe to RSS Feed
- Permalink
- Notify Moderator
Hi.
R K wrote:
AlvaroDíaz in the new worksheet the temperature dependence of Iph and Io is still not properly reflected as the graph showing effect of temperature variation illustrates the previous contrary behaviour of increasing power output with increase in temperature instead of decrease in output power with temperature increase.
I don't see that, I see the curve for high T having the lower power, and vice versa.
R K wrote:
Also, in the new worksheet, the reference values with additional subscript "0" (i.e. Iph0, Io0, a0 ,Rsh0 and Rs0) are all constants, only the variables without the additional subscript "0" are variable as they are temperature dependent. The graph showing the effect of varying is also not quite accurate since the value Iph0 of is being varied instead of varying Iph
How do you want to obtain a variation in Io or Iph? You have the plot of I-V where I, Io and Iph are varying with T. You can't plot Io nor Iph against V (well, you can, but it's an horizontal line, they are independent). Or maybe you want to plot Io and Iph versus T. Varying Io have the same sense than varying Rs0: they are properties of the materials, so, what you show are options for choosing some components or the complete PV set.
For Iph you can vary G, the irradiance. For do that, can put G as variable for I. For Io, as the "diode" cutoff, there are not much more options, other than change the PV set.
Alvaro.
- Mark as New
- Bookmark
- Subscribe
- Mute
- Subscribe to RSS Feed
- Permalink
- Notify Moderator
AlvaroDíaz The graph I see appears as below (green line - for highest temperature and red line for lowest temperature) red line (low T) should have highest power but instead produces lowest power output.
I don't plan to plot Io and Iph vs V but only I vs V. Maybe I need to write a program specifying all the 3 temperature alternatives and calculate corresponding values of Io and Iph then value of I and finally plot the three graphs instead of trying to change values while plotting the graph...

- Mark as New
- Bookmark
- Subscribe
- Mute
- Subscribe to RSS Feed
- Permalink
- Notify Moderator
Oh, I see. Check your Iph: isn't with plus alfa*(T-Tref), is with minus alpha. With plus, Iph grows with the temperature, and PV aren't thermal engines.
Best regards.
Alvaro.
- Mark as New
- Bookmark
- Subscribe
- Mute
- Subscribe to RSS Feed
- Permalink
- Notify Moderator
Well, that's a solution, but it isn't optimal, because don't reflect the system properly. Even, as model, if verify some properties, must to take as a well approximation, isn't that well. I grows with T, in the physical system, but at the same time V goes down, making the power to decrease as T grows. So, the principle that isn't a thermal system is preserved, not by the simple way of decreasing I. If you take alpha*(T-Tref) as positive for I, must to consider the voltaje variation as beta*(T-Tref), now, yes, with beta negative, and this combination represents better the physical system behavior.
Best regards.
Alvaro.
- Mark as New
- Bookmark
- Subscribe
- Mute
- Subscribe to RSS Feed
- Permalink
- Notify Moderator
I was finally able to plot it by following the instructions for "calling a function in another function". See this thread: Function of another function
I was able to call the functions Io and Iph as arguments in the function I; then on varying G and T and the plots worked out well.
Thank you for all your help! ![]()
- Mark as New
- Bookmark
- Subscribe
- Mute
- Subscribe to RSS Feed
- Permalink
- Notify Moderator
Hi. This set seems to model very well the system.
Best regards.
Alvaro.
- Mark as New
- Bookmark
- Subscribe
- Mute
- Subscribe to RSS Feed
- Permalink
- Notify Moderator
Hi ,
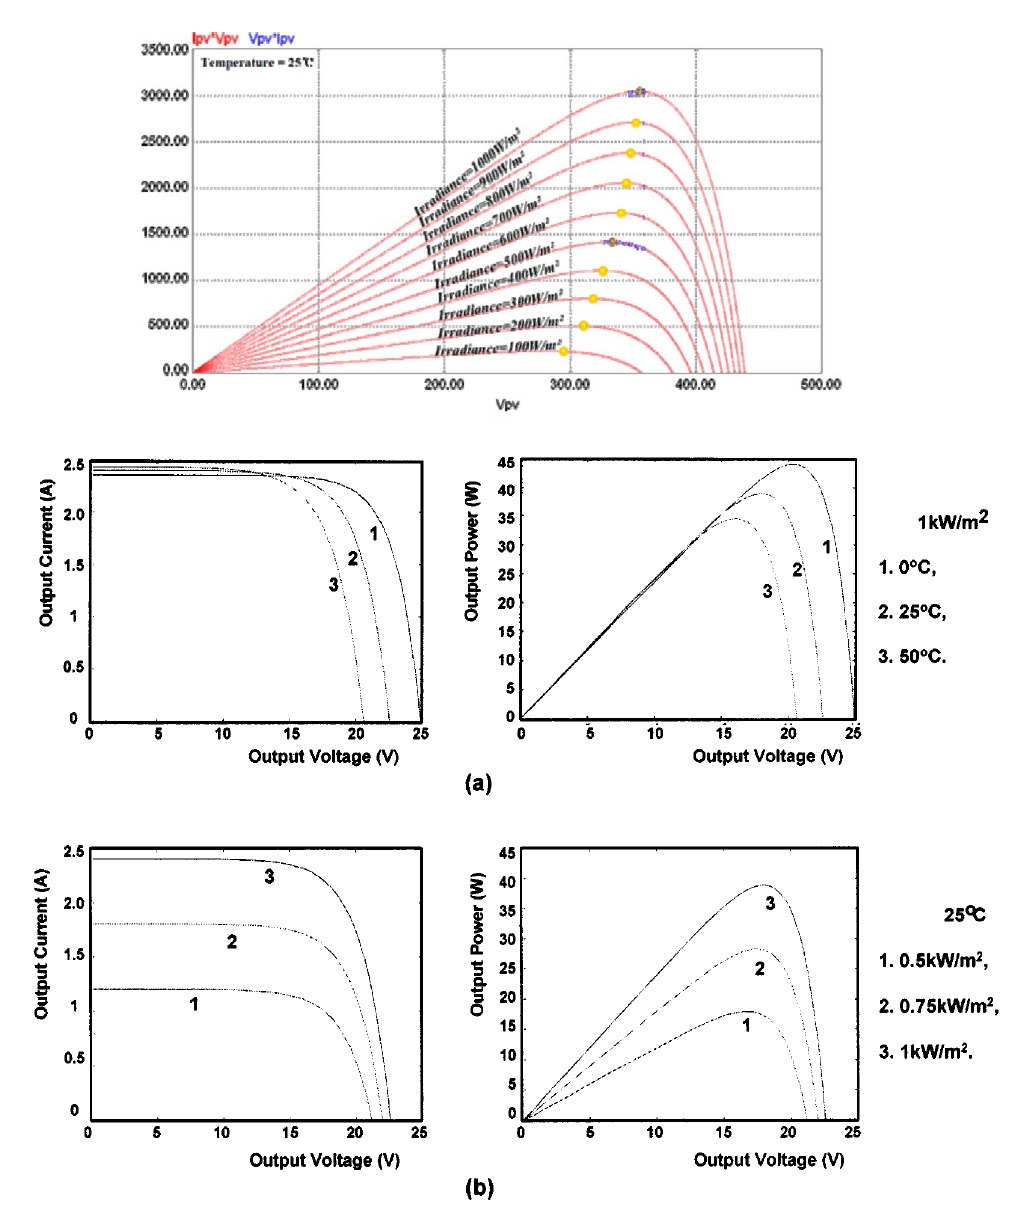
It happens that for the same (irradiation) power (note !!!), as the temperature increases (taken as a parameter), the power (and the current) curve (as a function of the voltage produced by the cell), has to move to the left. Your graphics, although they are accurate, however do not consider the same irradiation power for each of the three values of temperatures (parameters), as the voltage varies.
Bye
FM


