Community Tip - Your Friends List is a way to easily have access to the community members that you interact with the most! X
- Subscribe to RSS Feed
- Mark Topic as New
- Mark Topic as Read
- Float this Topic for Current User
- Bookmark
- Subscribe
- Mute
- Printer Friendly Page
Mathcad for high school physics problems and lab reports
- Mark as New
- Bookmark
- Subscribe
- Mute
- Subscribe to RSS Feed
- Permalink
- Notify Moderator
Mathcad for high school physics problems and lab reports
Hi,
The context for these questions is that I've recently finished the attached two tutorials, as well as the Mathcad Prime 1.0 Orientation and Working with units courses on PLMS4Schools. The attached two tutorials are exactly the kind of thing I want to use it for - to have my students use it as a scratchpad for doing physics and maths problems, and for writing up experiments, especially experiment data tables and plots.
However, from the perspective of an upper high school physics and maths teacher, there are two significant inadequacies in this regard:
Mathcad doesn't seem to have any feature that allows students to draw sketches "on the fly".
So many physics and maths problems require diagrams other than plots - think free body diagrams, electrical circuits, impulse-momentum, vectors, etc. In fact, I've seen several examples in the PLMS4schools courses of exercises where the problem is explained using a sketch of the forces on a beam - so how are these sketches produced?
Is the intention that they do these kind of things in another program (like Paint or Visio) and then insert them into the worksheet, or have I just not found the feature? If it does exist, there doesn't seem to be a lesson on it anywhere (I've searched the Learning Connector ad Knowledge Base for "Diagrams" "Sketch" and "Drawing" and nothing came up). A freehand sketch feature would be really useful.
2. I can't find a lesson anywhere on simply how to plot a linear line of best fit for a set of experimental data points (plotting "manually entered" data points, yes, but plotting and finding the slope of the line of best fit, no. I've looked through the "Design of Experiments Using Mathcad Prime 2.0" course, but it's way more advanced than what we need at high school level). Or simply to present experimental data in a table for that matter. I've checked all the likely-looking PLMS4schools courses, searched the e-learning connector and knowledge base, scanned through the "getting started" tutorial topics, and browsed the videos at
precisionlms.ptc.com/web/videos/mathcad/prime2.0/en/
but couldn't find anything. What would be really useful is a tutorial pitched at a similar level to the attached ones, entitled something like "High School Lab Reports with Mathcad Prime".
If there are any high school physics teachers out there who are already using Mathcad and have already solved the above problems, or even better, have already created a lesson on "High School Lab Reports with Mathcad Prime", please share!
Or if I'm just missing something, please let me know.
Thanks,
Benson
- Labels:
-
Algebra_Geometry
- Mark as New
- Bookmark
- Subscribe
- Mute
- Subscribe to RSS Feed
- Permalink
- Notify Moderator
Benson Wallace wrote:
2. I can't find a lesson anywhere on simply how to plot a linear line of best fit for a set of experimental data points
See please Matthcad functions slope, intercept, lintercept etc
Benson Wallace wrote:
If there are any high school physics teachers out there who are already using Mathcad and have already solved the above problems,
See please two my article about it. You can use the google translater.
Problems in physics: a new approach to solving - http://twt.mpei.ac.ru/ochkov/Mathcad-15/Physic.pdf
Teaching of mathematics and mathematical packages - http://twt.mpei.ac.ru/ochkov/Mathcad-15/OchkovMath.pdf
One arficle in englis http://twt.mpei.ac.ru/ochkov/Mathcad-15/SYSTEM-OF-EQUATIONS.pdf
- Mark as New
- Bookmark
- Subscribe
- Mute
- Subscribe to RSS Feed
- Permalink
- Notify Moderator
Thanks Valery,
Those articles are still a little high level for our purposes, but thanks for sharing.
I couldn't find the function "lintercept" when I search for it under "all functions". Is that an old command from an earlier version of Mathcad? I'm using Mathcad Prime 2.0 Academic version.
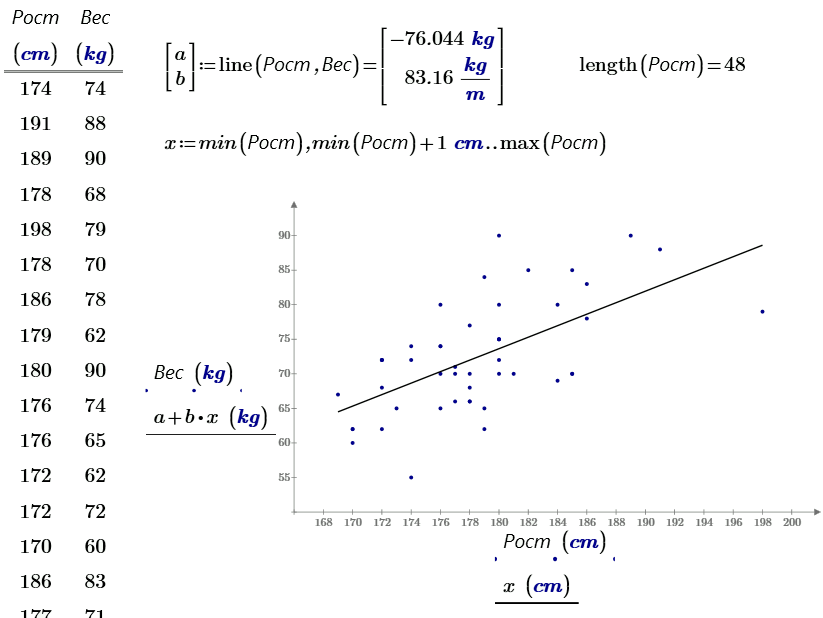
I did find a workaround for the line of best fit using the "line" function (see attached), but it would be nice if there was a way to automatically add the line of best fit without having to type "line(x,y)" and then define another function using the two coefficients that line(x,y) returns.
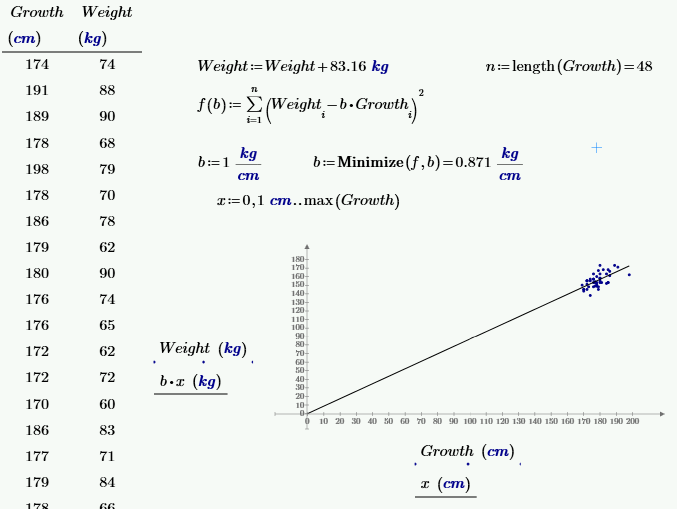
Another problem I have now is the following - how to force the line of best fit to pass through (0,0)? (which is something we often need to do in high school physics, for example if plotting force vs extension for a spring)
Cheers,
Benson
- Mark as New
- Bookmark
- Subscribe
- Mute
- Subscribe to RSS Feed
- Permalink
- Notify Moderator
See please this animation http://communities.ptc.com/videos/3543
This animation was described in this article
http://twt.mpei.ac.ru/ochkov/Mathcad-15/ScalarVector.pdf
One picture from the article (вес - mass of student, рост - growth of student):

- Mark as New
- Bookmark
- Subscribe
- Mute
- Subscribe to RSS Feed
- Permalink
- Notify Moderator
A propos
We can insert in the table (one new tool of Prime) values with different units - it is good!

- Mark as New
- Bookmark
- Subscribe
- Mute
- Subscribe to RSS Feed
- Permalink
- Notify Moderator
More

- Mark as New
- Bookmark
- Subscribe
- Mute
- Subscribe to RSS Feed
- Permalink
- Notify Moderator
- Mark as New
- Bookmark
- Subscribe
- Mute
- Subscribe to RSS Feed
- Permalink
- Notify Moderator
The attached might also help. Look under Functions, Curve Fitting and Smoothing for 'intercept' (it should be there unless the academic version has some restrictions in it).
Alan
- Mark as New
- Bookmark
- Subscribe
- Mute
- Subscribe to RSS Feed
- Permalink
- Notify Moderator
Thanks Valery, Alan and Werner,
A few follow up questions though:
Valery: that example in the picture looks like exactly what I need (including making the data appear in a table), except I still need to figure out how to force the line of best fit to go through (0,0). Also, I couldn't open your xmcd file in my Academic Version of Mathcad Prime 2.0 - the XMCD converter button is greyed out. Would you be able to convert the file to an MCDX file for me and re-attach it?
Werner: you've used "genfit" to find the best fitted line through (0,0), but I don't understand the input parameters. Do you know of a tutorial on genfit I can refer to?
Alan: I do have the intercept function in my version, but Valery was referring earlier to a function called "lintercept":
"See please Matthcad functions slope, intercept, lintercept etc"
Also, my problem is now not finding the slope and intercept, but rather finding the slope of the best fit line that must pass through (0,0). And also putting the data into a table, but once I can open Valery's file, that should be sorted.
Thanks for everyone's patience,
Benson
- Mark as New
- Bookmark
- Subscribe
- Mute
- Subscribe to RSS Feed
- Permalink
- Notify Moderator
- Mark as New
- Bookmark
- Subscribe
- Mute
- Subscribe to RSS Feed
- Permalink
- Notify Moderator
Forcing a least-squares best-fit straight-line to go through (0,0) is straightforward - see attached.
I've never come across a function called lintercept (as opposed to intercept) in any version of Mathcad, so perhaps this is one of Valery's own creations!
Alan
- Mark as New
- Bookmark
- Subscribe
- Mute
- Subscribe to RSS Feed
- Permalink
- Notify Moderator
Hi Alan,
Only just getting a chance to come back to this thread now - thanks for posting.
That solution looks nice and simple for use with upper high school students, but my statistics is a little rusty - could you remind me again why the slope that goes through the origin is given by (sum of xy) / (sum of x^2)?
Thanks!
Benson
ps - I'm actually now thinking it's better to not force the line to fit through the origin, so students can see the systematic error!
pps - do you know of a way to represent error bars on Mathcad plots, and then to find the maximum and minimum gradients of possible lines of best fit that pass through all those error bars (and hence their corresponding gradients and y-intercepts)?
- Mark as New
- Bookmark
- Subscribe
- Mute
- Subscribe to RSS Feed
- Permalink
- Notify Moderator
ppps - any ideas on how to represent/deal with uncertainties in measured values that you put into a data table using the "insert table" feature? I was really hoping to have my IBDP Physics students use Mathcad for their lab write-ups (which must include uncertainty treatment as described above) but I'm beginning to think I might have to abandon it for good old MS Word and Excel!
- Mark as New
- Bookmark
- Subscribe
- Mute
- Subscribe to RSS Feed
- Permalink
- Notify Moderator
pps - do you know of a way to represent error bars on Mathcad plots, and then to find the maximum and minimum gradients of possible lines of best fit that pass through all those error bars (and hence their corresponding gradients and y-intercepts)?
I answered that in the other thread you posted to: http://communities.ptc.com/message/258025#258025
- Mark as New
- Bookmark
- Subscribe
- Mute
- Subscribe to RSS Feed
- Permalink
- Notify Moderator
Werner: you've used "genfit" to find the best fitted line through (0,0), but I don't understand the input parameters. Do you know of a tutorial on genfit I can refer to?
To use genfit() you have to define the function you want to fit to your data - first parameter is the independend variable (x) and the following parameter(s) is/are the variables which define your function (in our case thats only the slope), so I defined f(x,k):=k*x) .
The parameters of genfit() are:
- vector of abscissa values of your data (X)
- vector of ordinate values of your data (Y)
- a vector with guess values of the variables genfit should fit, in our case thats only the slope so it must not be a vector but can be a scalar, I simply chosed 1
- the function name (without paranthesis and parameters) of the function to be used, in our case, f.
While there is a lot of information about Mathcad out there (in most cases you can benefit from reading about older versions as well) in form of books, internet sites, threads in this forum, etc., I am not aware of a complete "tutorial" on every single command and function like genfit(). But you should not underestimate what you already have installed and thats the built-in help. This always was a great strength of Mathcad and while the help in Prime is a bit more cumbersome, slow and less helpful than it used to be in older versions, its still a great ressource of information you should use.
You can find genfit() in the chpater on Curve Fitting Functions
http://www.ptc.com/cs/help/mathcad_hc/prime2_hc/index.jspx?id=resourceid-122-E3E8D819&action=show
and its here
http://www.ptc.com/cs/help/mathcad_hc/prime2_hc/index.jspx?id=resourceid-131-077D0BCB&action=show
you find an example (sure more elaborate than a homogenous linear function) here
I provided the links because the help is online, too, but you have it already installed locally.
So far in this thread you have now the choice amongst three methods:
- Directly use the math of least squares fit straightforeward as Alan showed (my favorit as its pure math and doesn't make use any fancy numerical iteration algorithm)
- use Mathcads genfit() function as in my sheet
- set up a function for the of squares and use Mathcads minimize() function to optimize the slope as in Valery's suggestion


