- Subscribe to RSS Feed
- Mark Topic as New
- Mark Topic as Read
- Float this Topic for Current User
- Bookmark
- Subscribe
- Mute
- Printer Friendly Page
Periodic Graphs
- Mark as New
- Bookmark
- Subscribe
- Mute
- Subscribe to RSS Feed
- Permalink
- Notify Moderator
Periodic Graphs
Hello Dear Friends,
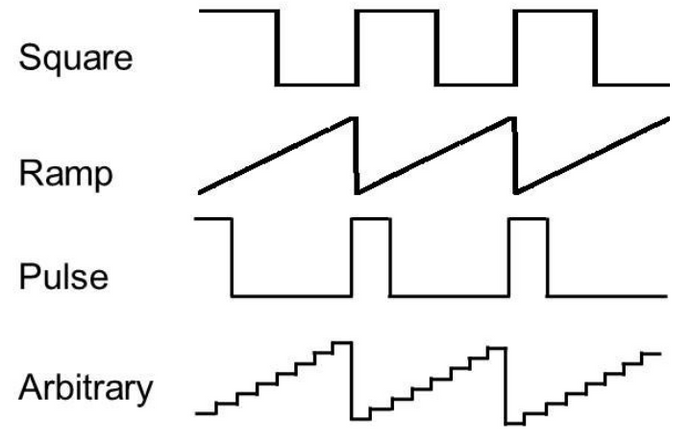
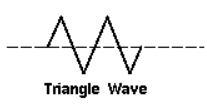
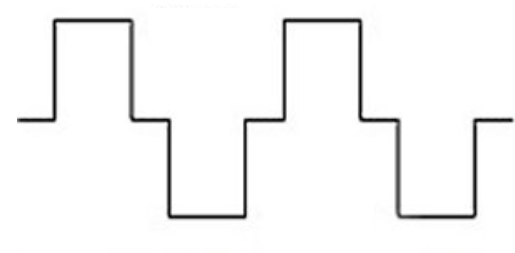
How can these graphs be implemented in the simplest way?
The graphs are periodic, as can be seen in the figures.
Thank you.
Best regards.
- Labels:
-
Electrical_Engineering
-
Programming
- Mark as New
- Bookmark
- Subscribe
- Mute
- Subscribe to RSS Feed
- Permalink
- Notify Moderator
Part of the answer is here:https://community.ptc.com/t5/PTC-Mathcad/Creation-of-Triangle-Waveform-and-Circuit-Analysis-with-Laplace/m-p/713387#M194463
Luc
- Mark as New
- Bookmark
- Subscribe
- Mute
- Subscribe to RSS Feed
- Permalink
- Notify Moderator
- Mark as New
- Bookmark
- Subscribe
- Mute
- Subscribe to RSS Feed
- Permalink
- Notify Moderator
Hello,
For several years I have created the collection of more or less useful signals that you find attached. Every now and then I make some changes to the files, the last one last year. I make extensive use of references to files outside the worksheet, but they are all contained in the folder, they are mostly data files for single signals. (The main worksheet is "Pulses and Waveforms"). If you download them you have to modify the references. I don't think it works after downloading it, you have to try. The attached pdf file gives you an idea of the results. (The layout is missing, sorry). (Waveforms Spectra is pdf only). There should be no mistakes but if you find any, let me know.
- Mark as New
- Bookmark
- Subscribe
- Mute
- Subscribe to RSS Feed
- Permalink
- Notify Moderator
On editing references:


