Community Tip - If community subscription notifications are filling up your inbox you can set up a daily digest and get all your notifications in a single email. X
- Subscribe to RSS Feed
- Mark Topic as New
- Mark Topic as Read
- Float this Topic for Current User
- Bookmark
- Subscribe
- Mute
- Printer Friendly Page
Plot Values in Reverse Order
- Mark as New
- Bookmark
- Subscribe
- Mute
- Subscribe to RSS Feed
- Permalink
- Notify Moderator
Plot Values in Reverse Order
Hello,
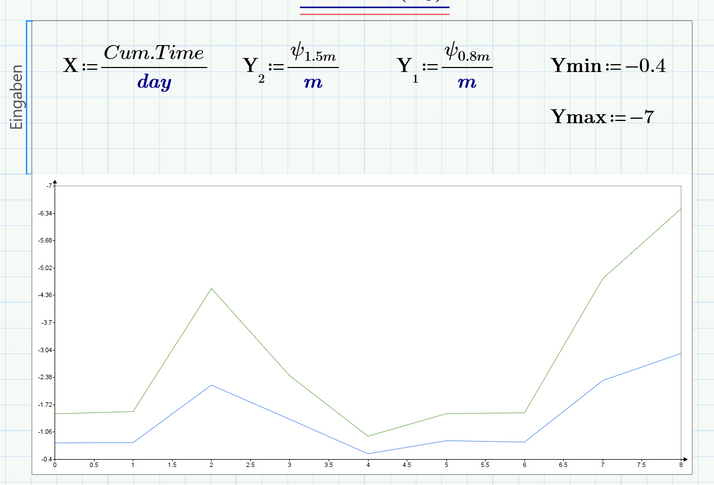
I want to plot my values in Y-Axis such that the lowest stays in the upper and the maximum stays at the bottom without changing the sign. How can I do it? Thank you very much.
Faisal
- Labels:
-
Mathcad Usage
-
Other
-
Programming
- Mark as New
- Bookmark
- Subscribe
- Mute
- Subscribe to RSS Feed
- Permalink
- Notify Moderator
That's not possible in Prime, but in (real) Mathcad (15 and before) it is possible without problems by changing the axis limits accordingly.
Success!
Luc
- Mark as New
- Bookmark
- Subscribe
- Mute
- Subscribe to RSS Feed
- Permalink
- Notify Moderator
You can do it in Prime but you would have to use the new chart component which was introduced with Prime 5. by defining Ymin and Ymax accordingly.
Unfortunately this chart component otherwise is just a piece of crap.
- Mark as New
- Bookmark
- Subscribe
- Mute
- Subscribe to RSS Feed
- Permalink
- Notify Moderator
May be so
- Mark as New
- Bookmark
- Subscribe
- Mute
- Subscribe to RSS Feed
- Permalink
- Notify Moderator
But the OP did not want to change the sign...
- Mark as New
- Bookmark
- Subscribe
- Mute
- Subscribe to RSS Feed
- Permalink
- Notify Moderator
@LucMeekes wrote:
But the OP did not want to change the sign…
Sori, Ai nou Inglish veri plokho!
- Mark as New
- Bookmark
- Subscribe
- Mute
- Subscribe to RSS Feed
- Permalink
- Notify Moderator
Thank you everyone for your help


