Community Tip - Want the oppurtunity to discuss enhancements to PTC products? Join a working group! X
- Subscribe to RSS Feed
- Mark Topic as New
- Mark Topic as Read
- Float this Topic for Current User
- Bookmark
- Subscribe
- Mute
- Printer Friendly Page
Plot for function is not working
- Mark as New
- Bookmark
- Subscribe
- Mute
- Subscribe to RSS Feed
- Permalink
- Notify Moderator
Plot for function is not working
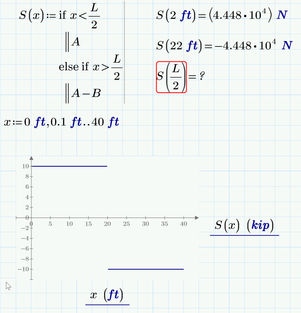
I want to frame a function to plot for Shear force
Solved! Go to Solution.
- Labels:
-
Mathcad Usage
Accepted Solutions
- Mark as New
- Bookmark
- Subscribe
- Mute
- Subscribe to RSS Feed
- Permalink
- Notify Moderator
Actually Luc already pointed out your main error - your function does not provide a value for x=L/2.
You have to decide which value S(L/2) should return. Because it was easier to do I simply replaced your "if else" for a simple "else".
As you can see it was not really necessary to delete the equal sign after the range definition which turns the range into a vector. This is because you used vectorization at S(x) and so you are plotting one vector of values over another.
But I consider it important that you know exactly what that little equal sign actually accomplishes. And you also should be aware, that this conversion of a range into a vector is an undocumented and thereby not supported feature.
Usually when you plot a function you would simply use a normal range for the abscissa values and the function (vectorization is not necessary) at the ordinate.
As you can see I also changed the second value in the range to decrease the step size and so get a "more vertical" line at the centre without noticeable slope.
BTW, the plot done that way would also work using your original function S(x). This function would still throw an error for x=L/2, but the rest would plot:
But of course in any case you should redefine S(x) in a way to return a value for any input value.
- Mark as New
- Bookmark
- Subscribe
- Mute
- Subscribe to RSS Feed
- Permalink
- Notify Moderator
Your little program
does not provide for the situation where x=L/2. That's what the error message points to.
You have to choose where L/2 should belong to, either A or A-B, or yet another value, then change the program accordingly.
Suppose it belongs to A-B, then you can just:
Next thing: You should delete the evaluation (=) in:
because it changes the range x into a vector. So just:
Then you can change the 9 to 40 and see the plot over the entire range to L.
Success!
Luc
- Mark as New
- Bookmark
- Subscribe
- Mute
- Subscribe to RSS Feed
- Permalink
- Notify Moderator
Actually Luc already pointed out your main error - your function does not provide a value for x=L/2.
You have to decide which value S(L/2) should return. Because it was easier to do I simply replaced your "if else" for a simple "else".
As you can see it was not really necessary to delete the equal sign after the range definition which turns the range into a vector. This is because you used vectorization at S(x) and so you are plotting one vector of values over another.
But I consider it important that you know exactly what that little equal sign actually accomplishes. And you also should be aware, that this conversion of a range into a vector is an undocumented and thereby not supported feature.
Usually when you plot a function you would simply use a normal range for the abscissa values and the function (vectorization is not necessary) at the ordinate.
As you can see I also changed the second value in the range to decrease the step size and so get a "more vertical" line at the centre without noticeable slope.
BTW, the plot done that way would also work using your original function S(x). This function would still throw an error for x=L/2, but the rest would plot:
But of course in any case you should redefine S(x) in a way to return a value for any input value.


