- Subscribe to RSS Feed
- Mark Topic as New
- Mark Topic as Read
- Float this Topic for Current User
- Bookmark
- Subscribe
- Mute
- Printer Friendly Page
Plot of main bisector
- Mark as New
- Bookmark
- Subscribe
- Mute
- Subscribe to RSS Feed
- Permalink
- Notify Moderator
Plot of main bisector
Hello !
I am trying to get a very simple plot, of the bisector in the first quadrant. For my application I am interested to have a graph for the range of relatively high values of abscissa, e.g. from 100000 up to 500000, like in the top left figure in the attached file (Mathcad Prime 8).
I’ve tried both “Plot” and “Chart Component”.
I am curious about what I have done wrong in my humble tries.
Thinking that such graphs can be carried out so smoothly in Mcd 15 in one minute…, thank you for any suggestion, best regards,
Liv.
Solved! Go to Solution.
- Labels:
-
Mathcad Usage
Accepted Solutions
- Mark as New
- Bookmark
- Subscribe
- Mute
- Subscribe to RSS Feed
- Permalink
- Notify Moderator
The Chart Component does not offer a "quickplot" feature (plotting a function without defining the abscissa values). Thats why your first Chart attempts failed. As Luc showed you have to define the abscissa values first.
As for the native plots, Prime does not allow to plot one range over another range
Interestingly it allows to plot a range over itself
Prime allows a range at the abscissa and a function dependent on that range at the ordinate:
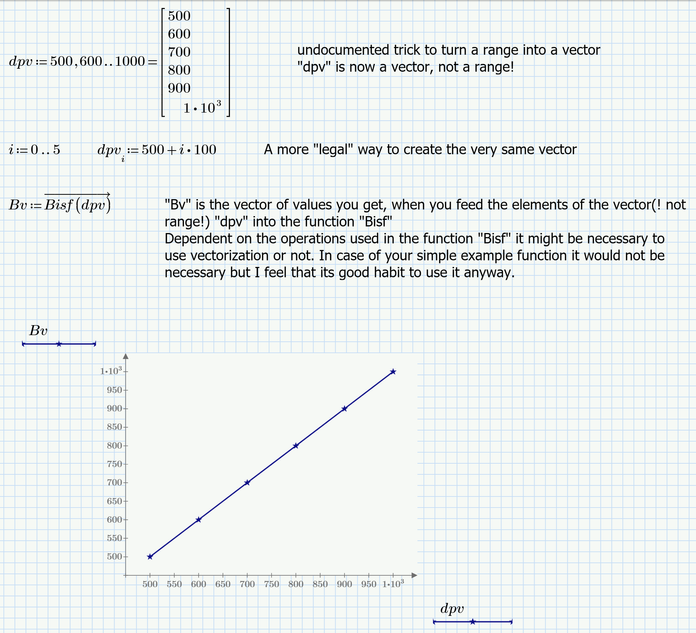
OR you can use vectors (not ranges) at both the abscissa and the ordinate:
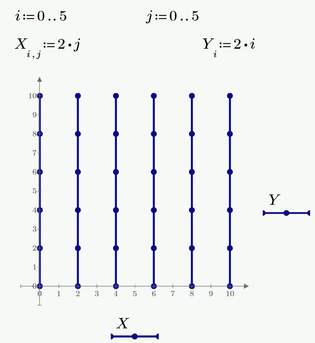
BTW, while Mathcad 15 would allow to plot one range over another, you don't get what you expect, either. What you get it kind of a waterfall plot:
- Mark as New
- Bookmark
- Subscribe
- Mute
- Subscribe to RSS Feed
- Permalink
- Notify Moderator
Just add this:
before the first graph to get this:
Or did you mean something else...?
Success!
Luc
- Mark as New
- Bookmark
- Subscribe
- Mute
- Subscribe to RSS Feed
- Permalink
- Notify Moderator
So it's not possible just to have as input merely a function expression, like in Mcd15 ?
Thank you,
Liv
- Mark as New
- Bookmark
- Subscribe
- Mute
- Subscribe to RSS Feed
- Permalink
- Notify Moderator
The Chart Component does not offer a "quickplot" feature (plotting a function without defining the abscissa values). Thats why your first Chart attempts failed. As Luc showed you have to define the abscissa values first.
As for the native plots, Prime does not allow to plot one range over another range
Interestingly it allows to plot a range over itself
Prime allows a range at the abscissa and a function dependent on that range at the ordinate:
OR you can use vectors (not ranges) at both the abscissa and the ordinate:
BTW, while Mathcad 15 would allow to plot one range over another, you don't get what you expect, either. What you get it kind of a waterfall plot:
- Mark as New
- Bookmark
- Subscribe
- Mute
- Subscribe to RSS Feed
- Permalink
- Notify Moderator
Ok, I see.
It seems to be more clumsy than expected to quickly have some curves plots.
Particularly when the function to plot will have some denominator roots, e.g. some polynomial at denominator.
Agree with you, it's healthier to use vectorize.
Yes, in MCd15 I used for vectors representation Xi and Yi on axes, where index i was indeed previously defined.
Argument "dpv" will be that defined array for the rest of the worksheet.
For a subsequent symbolic calculation one needs to use another variable as argument. Am I right ?
Thank you very much,
Liv.
- Mark as New
- Bookmark
- Subscribe
- Mute
- Subscribe to RSS Feed
- Permalink
- Notify Moderator
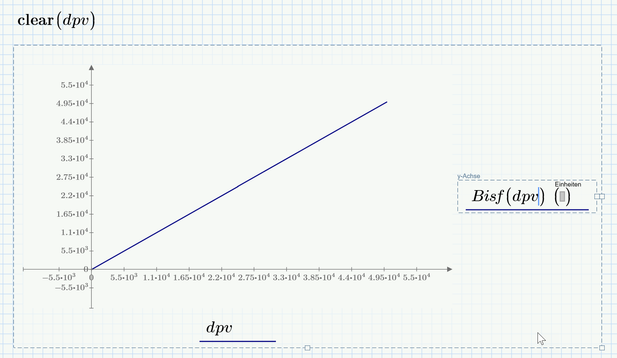
You can still use the quickplot feature for the native Prime plots the same way as in Mathcad 15. You simply have to use an undefined variable name at the abscissa. On contrary to Mathcad 15 we have a way in Prime to make a variable completely undefined again, the "clear" command.
Similar to Mathcad 15 the range you see in the plot is controlled by the values you set in the plot. In Prime you can edit the first, second and last value at each axis, so you can set start and and end value and step width that way.
As for subsequent symbolic evaluations you may either use the quickplot feature as just shown or, if you have already defined the abscissa values as a vector or range, you can either use a new undefined variable or make the already defined variable undefined again using the "clear" command.
You can also use the clear.sym(variablename) command to make the variable unknown/undefined for symbolic evaluations only. This is similar to using an assignment like variablename:=variablename in Mathcad 15.
- Mark as New
- Bookmark
- Subscribe
- Mute
- Subscribe to RSS Feed
- Permalink
- Notify Moderator
- Mark as New
- Bookmark
- Subscribe
- Mute
- Subscribe to RSS Feed
- Permalink
- Notify Moderator
I see.
After such assignments for each graph, one have to take care to variables names in a worksheet of several dozens of pages...
Thank you a lot, ttokoro,
Best, Liv.
- Mark as New
- Bookmark
- Subscribe
- Mute
- Subscribe to RSS Feed
- Permalink
- Notify Moderator
@Liv wrote:
I see.
After such assignments for each graph, one have to take care to variables names in a worksheet of several dozens of pages...
Thank you a lot, ttokoro,
Best, Liv.
In Mathcad 15 I usually used a variable name like x. or t. for plotting (note the dot!) because they would look the same like x or t which I still had free for something like symbolic evaluations.
In Prime the dot still would be seen in display and plot, but you could use the new clear() or clear.sym() commands like explained in my answer above to make the variables either completely unknown/undefined or just undefined for symbolic use.
- Mark as New
- Bookmark
- Subscribe
- Mute
- Subscribe to RSS Feed
- Permalink
- Notify Moderator
Yes, as explained above that's plotting one vector(!) over another one using the also already mentioned undocumented trick to turn a range into a vector using an inline assignment..
- Mark as New
- Bookmark
- Subscribe
- Mute
- Subscribe to RSS Feed
- Permalink
- Notify Moderator
And me who was wondering about why those figures at axes limits and in origin are flashing in thickness...
(I confess I've started to use Prime 3 days ago because someone asked me for help for his project).
I also use sometimes in Mcd 15 that trick with the point or with greek symbols
Anyway, you gave me a lot of infos very worthy to be remembered & used.
I am going to try them !
Thank you to all, best,
Liv.
- Mark as New
- Bookmark
- Subscribe
- Mute
- Subscribe to RSS Feed
- Permalink
- Notify Moderator

- Mark as New
- Bookmark
- Subscribe
- Mute
- Subscribe to RSS Feed
- Permalink
- Notify Moderator
I am not sure what you want to show with this!??
If your intention was to duplicate the waterfall plot of Mathcad 15 (which I only posted to demonstrate that MC15 allows to plot a range over a range but not with the desired result), you should use Primes "Waterfall Trace".
Note that Prime does not connect the individual traces. Doing so was an annoying bug in MC15 which only could be avoided (sometimes only partially) with workarounds like using "draw" instead of "lines" and/or manually limit the axis values.
- Mark as New
- Bookmark
- Subscribe
- Mute
- Subscribe to RSS Feed
- Permalink
- Notify Moderator
The last two posts seem to me both interesting.
Thank you for submitting,
Merry Christmas to all,
Liv.


