Community Tip - When posting, your subject should be specific and summarize your question. Here are some additional tips on asking a great question. X
- Subscribe to RSS Feed
- Mark Topic as New
- Mark Topic as Read
- Float this Topic for Current User
- Bookmark
- Subscribe
- Mute
- Printer Friendly Page
Plot two transfer function in one plot
- Mark as New
- Bookmark
- Subscribe
- Mute
- Subscribe to RSS Feed
- Permalink
- Notify Moderator
Plot two transfer function in one plot
Hi,
I am having few issue with plotting transfer function:
- Bode plot
- How to make line more obvious in the low frequency area?
- How to get ride of #4 zone of the plot, it doesn't have any
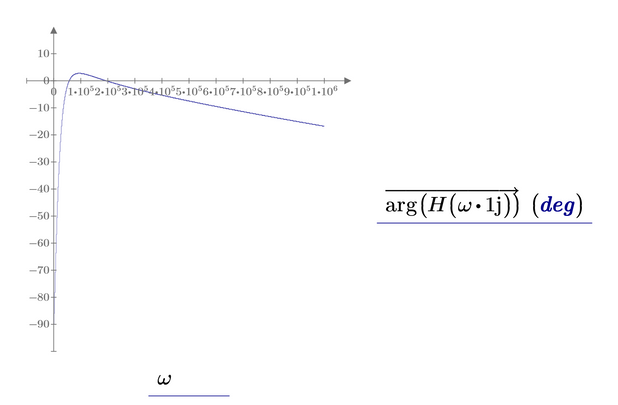
- I cannot plot phase plot, and i don't know why, please.
Attached is what i have done.
Solved! Go to Solution.
- Labels:
-
Electrical_Engineering
Accepted Solutions
- Mark as New
- Bookmark
- Subscribe
- Mute
- Subscribe to RSS Feed
- Permalink
- Notify Moderator
- Mark as New
- Bookmark
- Subscribe
- Mute
- Subscribe to RSS Feed
- Permalink
- Notify Moderator
The "error message" under the phase plot provides a potential clue! Try " Re(H(w*1j)) "
- Mark as New
- Bookmark
- Subscribe
- Mute
- Subscribe to RSS Feed
- Permalink
- Notify Moderator
omega is a range, not a vector and so you get into troubles when you use omega as argument in your function H.
H(omega*1j)= will display what looks like a vector (but isn't) and trying to assign it a variable like X:=H(omega*1j) would throw an error.
One way to deal with the problem would be to turn omega into a vector.
But I was surprised to see that just applying vectorization does the job as well:
Vectorization (the arrow over the expression) can be applied via its keyboard short or via the menu
EDIT: Actually it is a strange error as IMHO it SHOULD work the way you had tried to do.
EDIT2: Actually it indeed does work the way you had set it up. As I noticed later (see my answer below) simply recalculating the sheet makes the error vanish.
- Mark as New
- Bookmark
- Subscribe
- Mute
- Subscribe to RSS Feed
- Permalink
- Notify Moderator
This morning i copied a phase plot from other documents and it starts to work! this is wield!
- Mark as New
- Bookmark
- Subscribe
- Mute
- Subscribe to RSS Feed
- Permalink
- Notify Moderator
Strange, yes.
I just gave it a try, opened your original sheet (which shows the error) in Prime 9 and simply, without changing anything, let it recalculate - the plot showed up without any error.
But using log spaced values for omega and vectorization as shown is the better approach anyway.
- Mark as New
- Bookmark
- Subscribe
- Mute
- Subscribe to RSS Feed
- Permalink
- Notify Moderator
According the visibility of the traces in your first plot:
Prime only plots tiny points without connecting them if the trace consists of 50000 or more points which is the case in your plot. The settings for Symbol, Line Style and Trace Thickness are ignored, only the color can be changed. Using your range variable each trace consists of 200001 points.
One way to deal with is to decrease the number of points to be plotted by using a larger step in the range
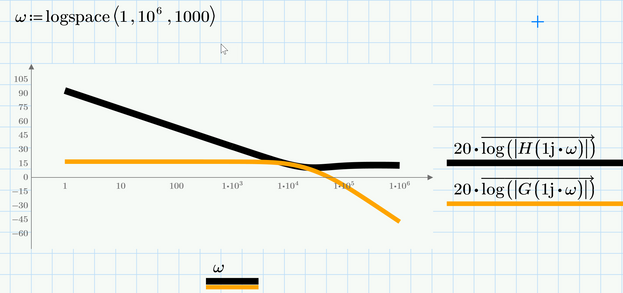
But as you have a logarithmically scaled abscissa, it would be a better idea to evenly space the omega values at the log x-axis. This can't be done using a range variable, but this is exactly what the functions "logpts()" and "logspace()" are made for.
As they create a vector and not a range, you should use vectorization when you use omega as function argument.
Here just 1000 points are used for plotting each trace:
Using a vector for omega and using vectorization when you use it also cures the problem with the "arg" function.
Prime 9 file attached
- Mark as New
- Bookmark
- Subscribe
- Mute
- Subscribe to RSS Feed
- Permalink
- Notify Moderator
Thanks, the 1,22,...10^6 trick worked! But last method didn't, on my side it didn't give me any error, but there is no line anymore in graph area.
- Mark as New
- Bookmark
- Subscribe
- Mute
- Subscribe to RSS Feed
- Permalink
- Notify Moderator
You will have to post the sheet so we could see what did not work and why.
Did you experience that "empty" plot right after opening my sheet?
Using logspace definitely is the better approach as (even though it works) its not a good idea to set up about half a million points for each trace to compute.
- Mark as New
- Bookmark
- Subscribe
- Mute
- Subscribe to RSS Feed
- Permalink
- Notify Moderator
- Mark as New
- Bookmark
- Subscribe
- Mute
- Subscribe to RSS Feed
- Permalink
- Notify Moderator
You forgot to vectorize the function calls at the y-axis!!
- Mark as New
- Bookmark
- Subscribe
- Mute
- Subscribe to RSS Feed
- Permalink
- Notify Moderator
Hi Wernner,
Is it possible to update the Mathcad sheet with units attached to all the electrical parameters
Jacob
- Mark as New
- Bookmark
- Subscribe
- Mute
- Subscribe to RSS Feed
- Permalink
- Notify Moderator
@JS_14451010 wrote:
Hi Wernner,
Is it possible to update the Mathcad sheet with units attached to all the electrical parameters
Jacob
I have no idea what I did here nearly three years ago 😉
But I guess it sure should be possible to use proper units throughout. After all that's a strength of Prime and should be done whenever possible.
I would suggest that you give it a try yourself and if you experience problems, open a new thread, explain your problem, attach the worksheet and also mention which version of Prime you are using.
Good luck!
- Mark as New
- Bookmark
- Subscribe
- Mute
- Subscribe to RSS Feed
- Permalink
- Notify Moderator
Werner,
Will do
Thanks
jacob
- Mark as New
- Bookmark
- Subscribe
- Mute
- Subscribe to RSS Feed
- Permalink
- Notify Moderator
As complex variable s is of unit 1/sec you have to add units to H(s) and G(s) in such a way so that their result is dimensionless. This usually would mean to replace the constant 1 by 1 V.
And if you are looking for unit mΩ to define R:=48 mΩ you will see that mΩ is not a predefined unit in Prime and you will have to define it yourself or use R:=0,048 Ω.


