Community Tip - Did you know you can set a signature that will be added to all your posts? Set it here! X
- Subscribe to RSS Feed
- Mark Topic as New
- Mark Topic as Read
- Float this Topic for Current User
- Bookmark
- Subscribe
- Mute
- Printer Friendly Page
Ploting real and imaginary numbers in 3D
- Mark as New
- Bookmark
- Subscribe
- Mute
- Subscribe to RSS Feed
- Permalink
- Notify Moderator
Ploting real and imaginary numbers in 3D
Hello,
I'm trying to plot the square root of the independent variable x,y. The z variable is the dependent.
.png)
Not sure to put it in matrix form or if there is a better way. Also how would it be possible to show real and imaginary numbers.
Thanks.
- Labels:
-
Algebra_Geometry
- Mark as New
- Bookmark
- Subscribe
- Mute
- Subscribe to RSS Feed
- Permalink
- Notify Moderator
Like so?
Alan
- Mark as New
- Bookmark
- Subscribe
- Mute
- Subscribe to RSS Feed
- Permalink
- Notify Moderator
Yes thank you very much. That worked perfectly. Now also I have a similar example where I tried to graph ln(2x^2+y^2). Its giving the same error as before. I tried using the setup you mentioned previously unable to make it work.
.png)
Thanks
- Mark as New
- Bookmark
- Subscribe
- Mute
- Subscribe to RSS Feed
- Permalink
- Notify Moderator
It's a different problem. ln(0) is undefined. Click on the x-axis, and change the lower limit to -9.9 instead of -10. That will make Mathcad miss the 0,0 point that causes the problem.

- Mark as New
- Bookmark
- Subscribe
- Mute
- Subscribe to RSS Feed
- Permalink
- Notify Moderator
As an alternative to Richards approach you could use the if function or the if statement in the function definition to avoid invalid values:

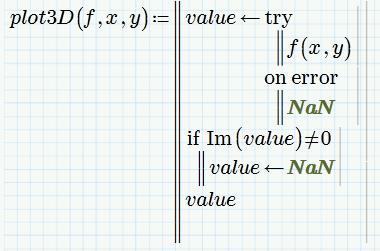
Here is a small utility routine which should work for most functions:

Usage:

Regards Werner
P.S.: Wish we could use NaN in 3D plots in Mathcad 15 😞


