Community Tip - Want the oppurtunity to discuss enhancements to PTC products? Join a working group! X
- Subscribe to RSS Feed
- Mark Topic as New
- Mark Topic as Read
- Float this Topic for Current User
- Bookmark
- Subscribe
- Mute
- Printer Friendly Page
Plotting Three Variables for WCSA on component selection
- Mark as New
- Bookmark
- Subscribe
- Mute
- Subscribe to RSS Feed
- Permalink
- Notify Moderator
Plotting Three Variables for WCSA on component selection
Hi
I have three variables in Inductance (L) value calculation for buck boost converter - Input Voltage, Output Voltage, Output Current. All three can vary. I would like to plot L value as a function of these three to determine the Worst case inductance requirement. In the attachment I have attempted 2D graph but how can look at sensitivity of L value this with 3 variables?
Regards
Prasanna
Solved! Go to Solution.
- Labels:
-
Other
Accepted Solutions
- Mark as New
- Bookmark
- Subscribe
- Mute
- Subscribe to RSS Feed
- Permalink
- Notify Moderator
Here is an approach using CreateMesh (which does not like units) and a plot showing the 3D graphs for four different values of I.out (3A, 2A, 1A and 0.5A). Your minimum value of 0.1 A yield quite large values for L which would let the other graphs look like zero planes.
I defined a auxiliary function L.3D which accepts three arguments and the fist one is I.out. This means that L.3D(2A) is treated as a two argument function (will not work in Prime).
Furthermore L.3D is written in a way that the last two arguments have to be unitless (Vin Vout). The unit volt is added before calling L.buck.
And at last the unit (H) is stripped of, so L.3D returns a simple unit-less scalar (which CreateMesh likes).
You may consider to multiply the result by 10^3 or 10^6 to show the result in mH or µH.
The function also sets any negative values to zero so its not necessary to limit the z-axis manually - you can leave autoscale on.
MC15 worksheet attached
- Mark as New
- Bookmark
- Subscribe
- Mute
- Subscribe to RSS Feed
- Permalink
- Notify Moderator
- Mark as New
- Bookmark
- Subscribe
- Mute
- Subscribe to RSS Feed
- Permalink
- Notify Moderator
Thanks Luc. I'm unable to see the graph though?
Regards
Prasanna
- Tags:
- ks L
- Mark as New
- Bookmark
- Subscribe
- Mute
- Subscribe to RSS Feed
- Permalink
- Notify Moderator
Ok Now I got the 2D working with your example. But 3D plot shows Div by Zero error. Any pointers?
Thanks
Prasanna
- Mark as New
- Bookmark
- Subscribe
- Mute
- Subscribe to RSS Feed
- Permalink
- Notify Moderator
@prasavijay wrote:
Ok Now I got the 2D working with your example. But 3D plot shows Div by Zero error. Any pointers?
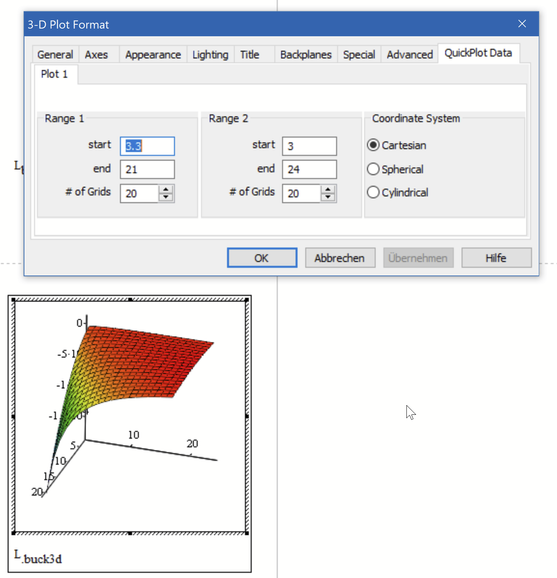
By default variables are running from -5 to +5 with a grid # of 20. The means that you are putting also zero values in your formula which give the division by zero.
Double click the plot to open the "3-D Plot Format" menu, go to "QuickPlot Data" and change the range for the input values as needed.
You may also play with the "Appearance" menu to change the look of the result.
You may also lookup the CreateMesh command and use it instead of changing the values in the "3-D Plot Format" menu.
- Mark as New
- Bookmark
- Subscribe
- Mute
- Subscribe to RSS Feed
- Permalink
- Notify Moderator
Why am I seeing negative values in the 3D Cartesian plot for Lbuck?
I don't expect negative values for the range of Vin, Vout, Io as I can see from 2D plot as well as XLS.
- Tags:
- he values
- Mark as New
- Bookmark
- Subscribe
- Mute
- Subscribe to RSS Feed
- Permalink
- Notify Moderator
@prasavijay wrote:
Thanks Luc. I'm unable to see the graph though?
In Lucs sheets autocalculation usually is turned off. Thats the reason you don't see the plots. Either manually recalculate the sheet (Ctrl-F9) or turn on autocalc (Tools - Calculate)
- Mark as New
- Bookmark
- Subscribe
- Mute
- Subscribe to RSS Feed
- Permalink
- Notify Moderator
Having three input and one result variable (L) would mean that you need a 4D-plot to visualize the whole situation in one single plot. Unfortunately we live in a 3D world and our screens are 2D. That means that you have to compromise. A 2D plot will show you just the change of L when you change one of the three inputs. You may show multiple 2D-graphs in one plot where a second input variable is changed in discrete steps.
You may also use a 3D plot showing the influence of two inputs in one single plot. having multiple 3D graphs in one plot would be possible, too, but I guess it would be more confusing than helpful.
Anyway, visualizing the influence of any of the three inputs in one single plot seems to much demanded.
Whats the main goal?
- Tags:
- You may
- Mark as New
- Bookmark
- Subscribe
- Mute
- Subscribe to RSS Feed
- Permalink
- Notify Moderator
The goal is to vary the three inputs or atleast two and look at the Inductance variation (min-max) to determine the inductance value. This seems to be the straightforward thing to do with XLS, but I'm having hard time with Mathcad doing similar. I have attached an example with XLS.
- Mark as New
- Bookmark
- Subscribe
- Mute
- Subscribe to RSS Feed
- Permalink
- Notify Moderator
So you are not looking for a continuous graph but just want to see the results for a few selected input values?
Here is what your Excel sheet shows done in Mathcad. I replaced the bars by line plots as Mathcads "bar" and "solidbar" styles seems not appropriate. You might consider a "stem plot" as a line plot doen't make much sense given the rather arbitrary input values.
I also added a variant using units and a differently scaled secondary y-axis.
Mathcad 15 file attached
- Mark as New
- Bookmark
- Subscribe
- Mute
- Subscribe to RSS Feed
- Permalink
- Notify Moderator
Thanks, I will check this and update.
- Tags:
- I will
- Mark as New
- Bookmark
- Subscribe
- Mute
- Subscribe to RSS Feed
- Permalink
- Notify Moderator
I'm looking for continuous plot and shall use limited array of points only if 3D plot is having limitation. Need to understand the reason for negative L values
- Mark as New
- Bookmark
- Subscribe
- Mute
- Subscribe to RSS Feed
- Permalink
- Notify Moderator
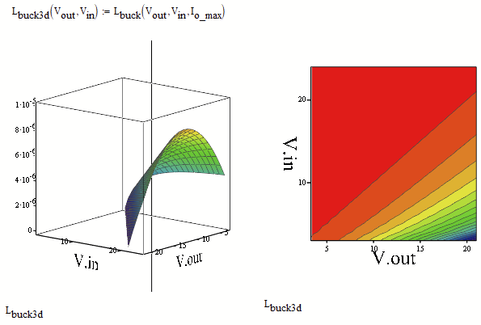
You sure get negative values for Vout>Vin
You may limit the values for the z-axis to 0 up to 1e-5 (you cannot type 10^-5 in the 3Dplot applet) and can you see something like this (red are negative values):
- Mark as New
- Bookmark
- Subscribe
- Mute
- Subscribe to RSS Feed
- Permalink
- Notify Moderator
Here is an approach using CreateMesh (which does not like units) and a plot showing the 3D graphs for four different values of I.out (3A, 2A, 1A and 0.5A). Your minimum value of 0.1 A yield quite large values for L which would let the other graphs look like zero planes.
I defined a auxiliary function L.3D which accepts three arguments and the fist one is I.out. This means that L.3D(2A) is treated as a two argument function (will not work in Prime).
Furthermore L.3D is written in a way that the last two arguments have to be unitless (Vin Vout). The unit volt is added before calling L.buck.
And at last the unit (H) is stripped of, so L.3D returns a simple unit-less scalar (which CreateMesh likes).
You may consider to multiply the result by 10^3 or 10^6 to show the result in mH or µH.
The function also sets any negative values to zero so its not necessary to limit the z-axis manually - you can leave autoscale on.
MC15 worksheet attached


