Community Tip - If community subscription notifications are filling up your inbox you can set up a daily digest and get all your notifications in a single email. X
- Subscribe to RSS Feed
- Mark Topic as New
- Mark Topic as Read
- Float this Topic for Current User
- Bookmark
- Subscribe
- Mute
- Printer Friendly Page
Plotting Trouble in Mathcad 7 Prime
- Mark as New
- Bookmark
- Subscribe
- Mute
- Subscribe to RSS Feed
- Permalink
- Notify Moderator
Plotting Trouble in Mathcad 7 Prime
Hello,
I want to plot some functions:
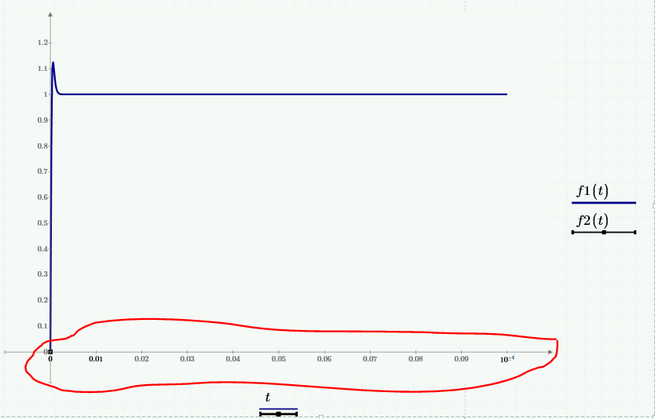
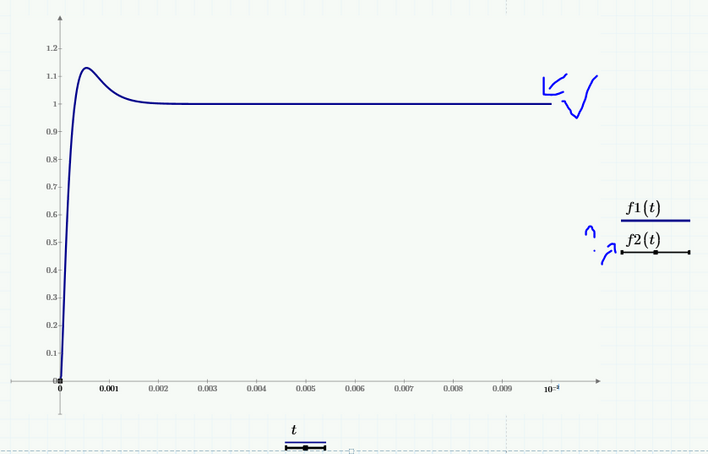
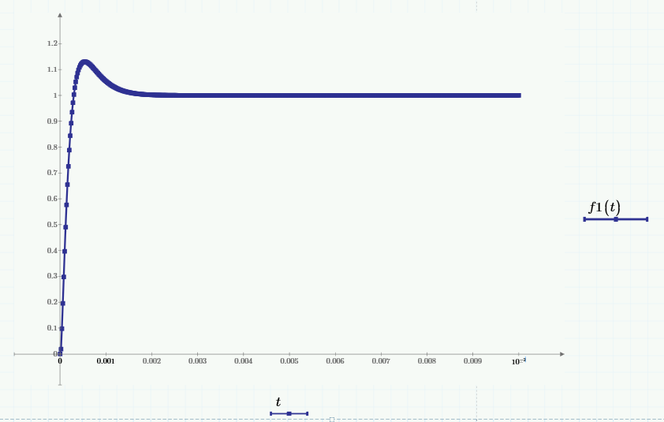
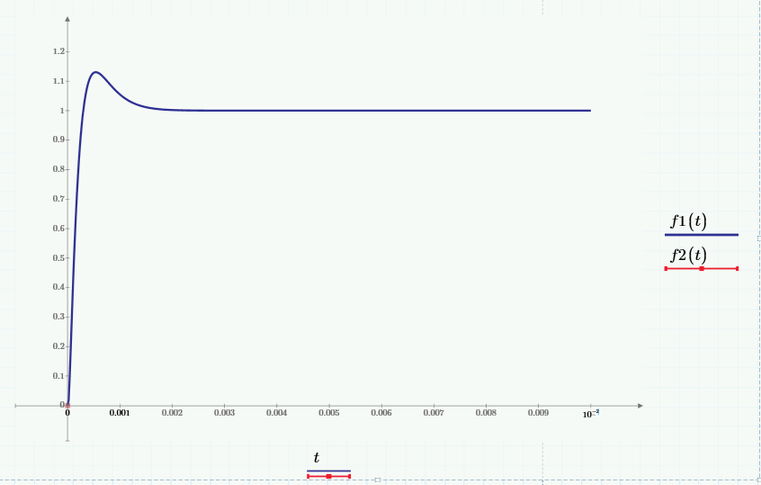
And the function f2(t) should look similar to the function f1(t), not exactly, but something like f1(t) looks.
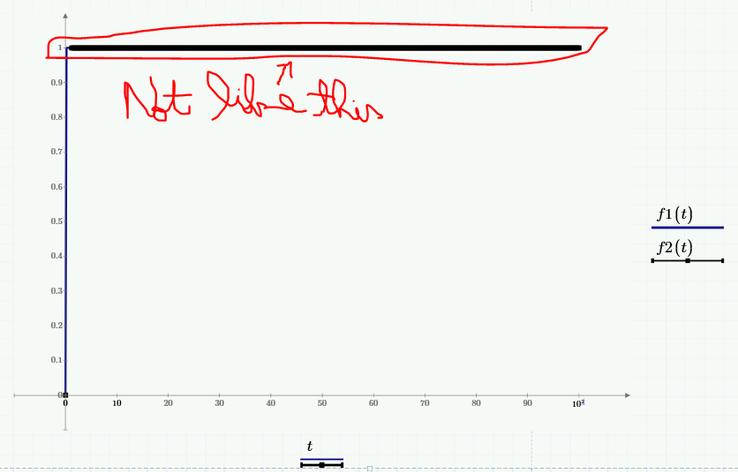
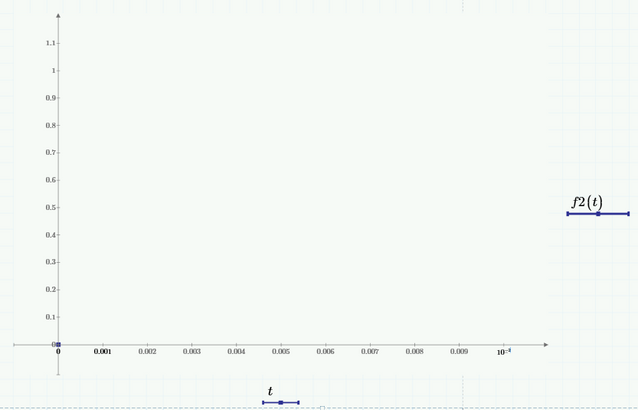
The problem is that the graph of the function f2(t) is displayed only when I increase the time axis so much (10^1, 10^2, 10^3, etc), which is a bit much because I want to see this part (see image below) from the beginning as it looks, not a straight line
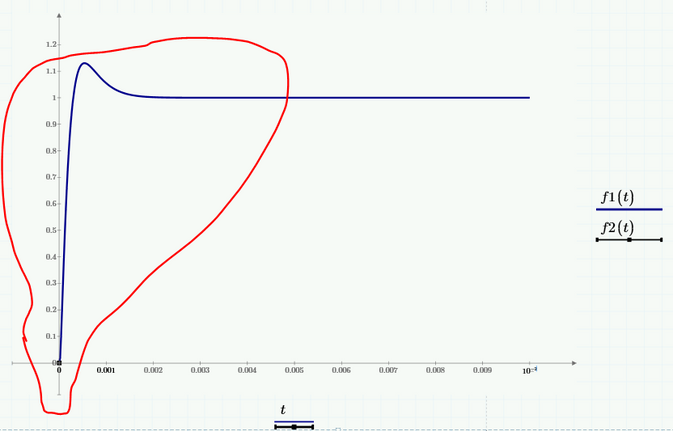
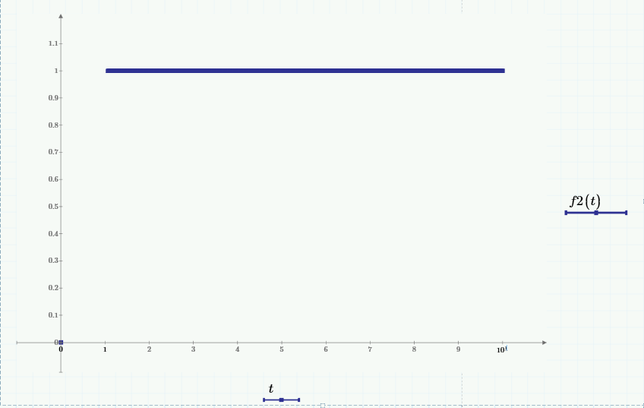
And not like this (see image below), because I want to be able to see the transient/beginng part much more, how will look (like the image shown above)
Good:
Bad
Bad
I would like, if it is possible, to plot both functions on the same graph and to be able to see the beginning part for the function f2(t) just as I can see it in the case of the function f1(t)
Mathcad Prime 7 file attached.
Thanks.
Solved! Go to Solution.
- Labels:
-
Electrical_Engineering
-
Mathcad Usage
Accepted Solutions
- Mark as New
- Bookmark
- Subscribe
- Mute
- Subscribe to RSS Feed
- Permalink
- Notify Moderator
Have you checked the values that f2(t) gives a s a function of t?
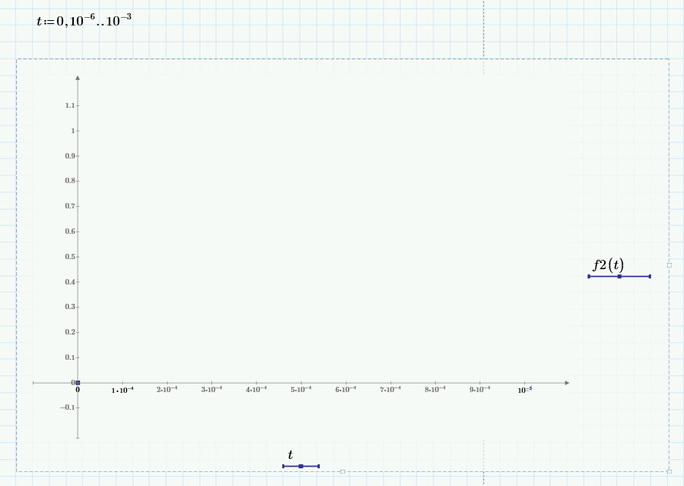
There's only ONE real result in the range for t=0..0.01, that is when t=0; for all other values of t, f2(t) gives a complex result.
The next thing you need to know (remember) is that Mathcad doesn't plot complex values. Now because there's one real result value, you get no error message, but the complex values still don't plot.
You can decide to plot the real part, or the imaginary part of f2(t), then you might get:
respectively:
and you can also plot the magnitude:
Success!
Luc
- Mark as New
- Bookmark
- Subscribe
- Mute
- Subscribe to RSS Feed
- Permalink
- Notify Moderator
Yes, that's it, the function f2(t) also has complex values for the exponent of e: e^(a+b*i), in addition to real values of the exponent of e: e^(c), and unlike the function f1(t) which only has real values of the exponent of e (e being multiplied only by real values in both cases: d*e^(...)), and a,b,c,d represent real values. Only its exponent of e is different, in one case (f1(t)) has only real values, and in the other case (f2(t)) has also complex values in addition to real values of the exponent of e.
OK. Thank you for the answer. If anything else comes up I will post.

