Community Tip - Stay updated on what is happening on the PTC Community by subscribing to PTC Community Announcements. X
- Subscribe to RSS Feed
- Mark Topic as New
- Mark Topic as Read
- Float this Topic for Current User
- Bookmark
- Subscribe
- Mute
- Printer Friendly Page
Polyfit
- Mark as New
- Bookmark
- Subscribe
- Mute
- Subscribe to RSS Feed
- Permalink
- Notify Moderator
Polyfit
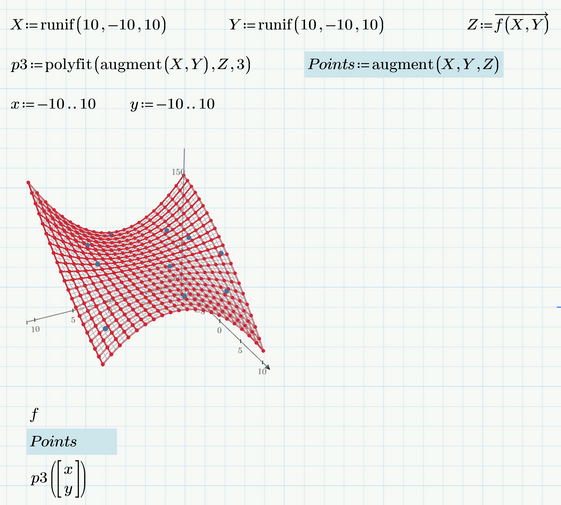
I defined a function of x and y and plotted it. Later I am calculating matrix values for the function and trying to create a second function to fit the points. My belief was it should result in the first function but the second function deviated from first by large margin. How to rectify this?
Solved! Go to Solution.
- Labels:
-
Mathcad Usage
Accepted Solutions
- Mark as New
- Bookmark
- Subscribe
- Mute
- Subscribe to RSS Feed
- Permalink
- Notify Moderator
- Mark as New
- Bookmark
- Subscribe
- Mute
- Subscribe to RSS Feed
- Permalink
- Notify Moderator
You only use x=y's 21 points (green plot) of the function to polyfit it.
Using all 441 points data to polyfit function, we get the next plot. Yellow plot is polyfit(,U,V, 2) and Red plot is polyfit(,U,V, 3). Polyfit area expands to -15,-14.5..15 for both x and y data.
- Mark as New
- Bookmark
- Subscribe
- Mute
- Subscribe to RSS Feed
- Permalink
- Notify Moderator
Can you please share the updated worksheet
- Mark as New
- Bookmark
- Subscribe
- Mute
- Subscribe to RSS Feed
- Permalink
- Notify Moderator
While ttokoro is looking for his missing worksheet here are my 2 cents
Here you see in blue the points which you provided for polyfit to find a fitting surface and you see that polyfit succeeded in finding a surface of third order through all your points 😉
If you provide a full mesh of points you get the result you expected.
You may also use "polyfitc" to look for the factors which polyfit finds
The -0.2 in the row with "AAB" is the coefficient of x^2*y, etc.
Prime worksheet attached
- Mark as New
- Bookmark
- Subscribe
- Mute
- Subscribe to RSS Feed
- Permalink
- Notify Moderator
- Mark as New
- Bookmark
- Subscribe
- Mute
- Subscribe to RSS Feed
- Permalink
- Notify Moderator
One additional remark:
The 21 points you used were too special (because x = y for all of them) but normally 10 random points should suffice to define the cubic:


