Community Tip - New to the community? Learn how to post a question and get help from PTC and industry experts! X
- Subscribe to RSS Feed
- Mark Topic as New
- Mark Topic as Read
- Float this Topic for Current User
- Bookmark
- Subscribe
- Mute
- Printer Friendly Page
RE Bending moment and shear force diagram
- Mark as New
- Bookmark
- Subscribe
- Mute
- Subscribe to RSS Feed
- Permalink
- Notify Moderator
RE Bending moment and shear force diagram
Almost there guys.
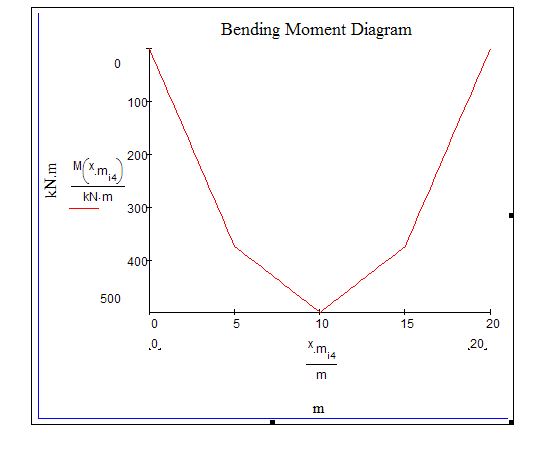
I've manage to draw the shear force diagram from some given numbers, I'm now trying to plot the bending moment diagram but for some reason I'm getting an error on the moment axis.
any suggestions or assistance would be greatly appreciated.
- Labels:
-
Other
- Mark as New
- Bookmark
- Subscribe
- Mute
- Subscribe to RSS Feed
- Permalink
- Notify Moderator
M is a function of x, so you should have x.m on one axis and M(x.m) on the other.
However, you have an error in the definition of M. W is a two element vector, but i ranges from 1 to 4, so the index is out of range.
- Mark as New
- Bookmark
- Subscribe
- Mute
- Subscribe to RSS Feed
- Permalink
- Notify Moderator
Thanks Richard, I'll have a look and get back to you
- Mark as New
- Bookmark
- Subscribe
- Mute
- Subscribe to RSS Feed
- Permalink
- Notify Moderator
There's an easier, more general way to do this type of problem; vectors for plotting are poor for this.
- Mark as New
- Bookmark
- Subscribe
- Mute
- Subscribe to RSS Feed
- Permalink
- Notify Moderator
Thanks Fred, although the way you've shown is the generally way to do this. with the vectors, the mathcad sheet can be given to someone with hardly any knowledge of mathcad. so the only thing they need to do is add as many point loads and UDL's to the span of the beam and the sheet will work it out.
They don't need to go into the formula's to re write the equation.
See new attachment with the original problem
- Mark as New
- Bookmark
- Subscribe
- Mute
- Subscribe to RSS Feed
- Permalink
- Notify Moderator
So your challenge is to write the functions from the vectors . . .
- Mark as New
- Bookmark
- Subscribe
- Mute
- Subscribe to RSS Feed
- Permalink
- Notify Moderator
Thanks Guys, shear force and bending moment diagram drawn, two more questions, how can a invert the graph so the bending moment and shear are the other way?
and how do I change the units to kN.m and m to the graph.. you can see the numbers at present are not correct
model attached
- Mark as New
- Bookmark
- Subscribe
- Mute
- Subscribe to RSS Feed
- Permalink
- Notify Moderator
Divide the variables on the axes by the appropriate unit. Then type limits into the top and bottom placeholders on the y-axis.

- Mark as New
- Bookmark
- Subscribe
- Mute
- Subscribe to RSS Feed
- Permalink
- Notify Moderator
Thanks Rich, is that the only way to invert the graph by typing the upper and lower limits in the place holders
- Mark as New
- Bookmark
- Subscribe
- Mute
- Subscribe to RSS Feed
- Permalink
- Notify Moderator
is that the only way to invert the graph by typing the upper and lower limits in the place holders
Yes. Unfortunately there is no setting for this.
- Mark as New
- Bookmark
- Subscribe
- Mute
- Subscribe to RSS Feed
- Permalink
- Notify Moderator
You program crashes for a distributed load w = (10 0) produces no moment!
(Note that for a distributed load shear will not be a horizontal line but will have a slope equal to the negative of the distributed load. For that case the moment should be a second order curve. Plotting vectors would require a straight line point-to-point function.
- Mark as New
- Bookmark
- Subscribe
- Mute
- Subscribe to RSS Feed
- Permalink
- Notify Moderator
yes, I've had this working once but looks like I've changed something... any idea?
- Mark as New
- Bookmark
- Subscribe
- Mute
- Subscribe to RSS Feed
- Permalink
- Notify Moderator
infact this file still gives me the max bending moment. its the formula for plotting the bending moment diagram which is erroring out.
- Mark as New
- Bookmark
- Subscribe
- Mute
- Subscribe to RSS Feed
- Permalink
- Notify Moderator
manage to sort the erroring out of the bending moment. just need to inverse the plot automatically
- Mark as New
- Bookmark
- Subscribe
- Mute
- Subscribe to RSS Feed
- Permalink
- Notify Moderator
I can attach the file Fred it you'd like to have a look
- Mark as New
- Bookmark
- Subscribe
- Mute
- Subscribe to RSS Feed
- Permalink
- Notify Moderator


