Community Tip - Did you get called away in the middle of writing a post? Don't worry you can find your unfinished post later in the Drafts section of your profile page. X
- Subscribe to RSS Feed
- Mark Topic as New
- Mark Topic as Read
- Float this Topic for Current User
- Bookmark
- Subscribe
- Mute
- Printer Friendly Page
Root error interval signs
- Mark as New
- Bookmark
- Subscribe
- Mute
- Subscribe to RSS Feed
- Permalink
- Notify Moderator
Root error interval signs
Hello Friends,
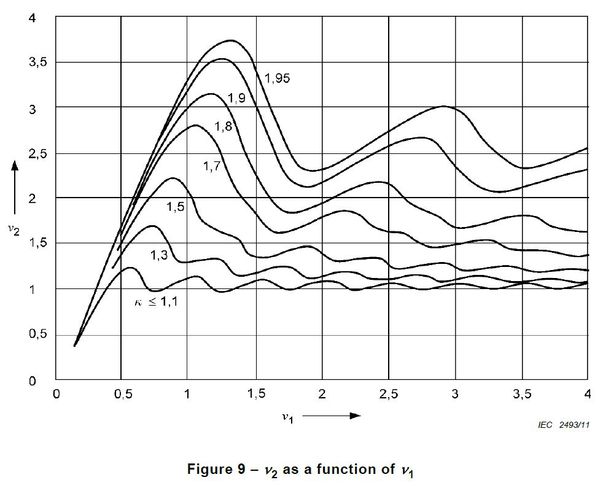
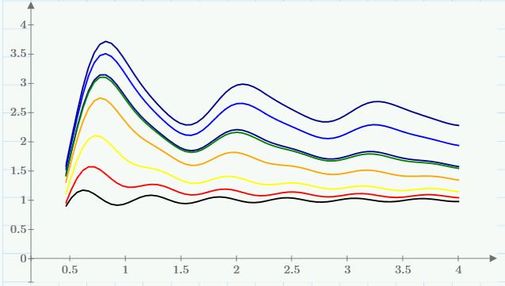
I am trying to plot something as attached below. Where v2 is a function of v1 and varies according to third variable k.
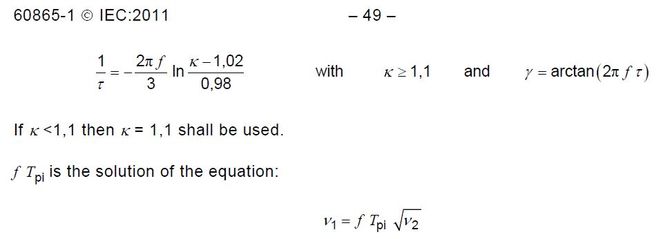
v1 is given by an equation as :
Now as for programming purpose, v1 equation is given as
But when I am trying to solve the equation using root of function k, v1 as for v2, it produce an error that end points of interval must be of opposite signs. Whereas, v2 value can not be in negative as shown in graph above. I have assigned rang from 0 to 4 as mentioned in vertical axis of graph.
Can anyone please explain or tell me why I am getting this error and how to solve this problem.
Thanks !!
- Labels:
-
Electrical_Engineering
-
Mathcad Usage
- Mark as New
- Bookmark
- Subscribe
- Mute
- Subscribe to RSS Feed
- Permalink
- Notify Moderator
The first formal analyze your calculation - the creating one user function:

Show please the article or the book with this formulas!
- Mark as New
- Bookmark
- Subscribe
- Mute
- Subscribe to RSS Feed
- Permalink
- Notify Moderator
There is one more equation given for the reference. I am not sure whether I am using the correct function or not.
- Mark as New
- Bookmark
- Subscribe
- Mute
- Subscribe to RSS Feed
- Permalink
- Notify Moderator
Hi,
Attached is the IEC reference. Pages are extracted from the IEC where these calculations are defined.
@terryhendicott Yes you are right that the value of v1, given in my worksheet, doesnt exist in graph but the value of v2 is gradually linear over the increasing value of v1 so as its empirical equations so conservative values are sufficient.
Thanks & Cheers !
- Mark as New
- Bookmark
- Subscribe
- Mute
- Subscribe to RSS Feed
- Permalink
- Notify Moderator
It looks to me that you will have to define v1 and v2 to be functions dependent on frequency f and kappa.
All other variables must be known or be setup as functions of f and/or kappa, e.g. don't write just tau but use tau(f,kappa) and define the function tau(f,kappa) := 1/(-2 pi f / 3 *ln( (kappa-1.02)/0.98 ) )
If you do this you should be able to recreate Fig. 8, I guess.
- Mark as New
- Bookmark
- Subscribe
- Mute
- Subscribe to RSS Feed
- Permalink
- Notify Moderator
- Mark as New
- Bookmark
- Subscribe
- Mute
- Subscribe to RSS Feed
- Permalink
- Notify Moderator
So here is what the plots look like using the functions you created.
Not sure if T.pi really should be a function argument
- Mark as New
- Bookmark
- Subscribe
- Mute
- Subscribe to RSS Feed
- Permalink
- Notify Moderator
Here's a slightly different approach making it easier to duplicate the plot in the screenshot. I added a grid to make it easier to compare.
Differences might be because of differences in the functions or differences in the frequency range or the value of T.pi.
- Mark as New
- Bookmark
- Subscribe
- Mute
- Subscribe to RSS Feed
- Permalink
- Notify Moderator
Hi, Can anyone please convert these files suitable for Prime 3.1 ? I am unable to open them.
@Werner_E Thanks for your suggestion here. I am also confused with the value Tpi as its also not given in any equation. I was just assuming it as 8ms but actual value not found. If you see the last page of my attachement IEC, theres one more equation exist which tells the relation between v1, v2 and Tpi (v1=f'*Tpi*sqrtv2) so my queation is will it be possible to find out a approximate value of Tpi as well with the given equations?
Thanks for your help.
- Mark as New
- Bookmark
- Subscribe
- Mute
- Subscribe to RSS Feed
- Permalink
- Notify Moderator
I can only provide a pdf of the file. Its attached
I had not looked at the document you provided but just worked along an what Terry had come up with.
As you can see had Terry already used the relation you are referring to to define v1.
So unless there is another relation between v1, v2 and Tpi, the value of Tpi has to be known.
Maybe there is a relation between f', kappa and Tpi so Tpi can be calculated if f' and kappa are known?
- Mark as New
- Bookmark
- Subscribe
- Mute
- Subscribe to RSS Feed
- Permalink
- Notify Moderator
Hi Werner,
Yes intially I was in same impression but later realized that actually its a function of k and f' or better to say it should be as its not given. But thats okay it can be figure out further.
Now I have you pdf so I can atleast see the definitions and can implement in my worksheet.
Thanks again for your great help.
Cheers !
- Mark as New
- Bookmark
- Subscribe
- Mute
- Subscribe to RSS Feed
- Permalink
- Notify Moderator
Hi @Werner_E,
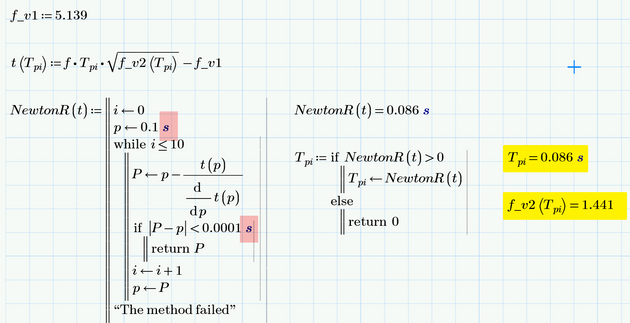
Here is an another approach (Newton Raphson) to find the exact value of Tpi with relation of v1 and v2 as documented in IEC.
With your given method, the reason value was not matching precisely is that Tpi value was defined as a constant while solving the equation v2 but in actually, its not a constant and vary with v1 and v2. Reason behind is that level of short circuit current and magnitude wrt to 1s duration. After calculated Tpi with Newton Raphson method, the value is much closer to the actual plot whic is good and the bad is units. Its only runs when I am removing the unit from f(frequency:= 50Hz) variable but with the unit, its throwing an error "unit not compatiable".
I am not able to figure out why there is an error with Hz. Can you have a look into it? Worksheet is attached for reference with unit(Hz) and result below without unit(Hz) and yes Tpi should have come in second.
Thanks for your help again.
- Mark as New
- Bookmark
- Subscribe
- Mute
- Subscribe to RSS Feed
- Permalink
- Notify Moderator
You assigned f the unit Hz but f_v1 is unitless. Therefore your function t assumes its argument to be of dimension time as you can subtract dimensionless from frequency.
This said means of course that you will have to add a unit of time to the argument of your function in your NewtonR function, too. See screenshot.
- Mark as New
- Bookmark
- Subscribe
- Mute
- Subscribe to RSS Feed
- Permalink
- Notify Moderator
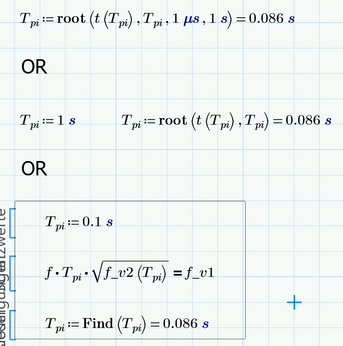
BTW, instead of using Newton you could make use of Primes built-in numerical methods.
- Mark as New
- Bookmark
- Subscribe
- Mute
- Subscribe to RSS Feed
- Permalink
- Notify Moderator
Hi @Werner_E
I have tried root method for Tpi but the plottong is not the same as It was earlier with constant Tpi. Slight difference is there like all the lines are not begining with 0 and the flow is slightly different. Can you have a look the reason?
Thanks & Cheers !
- Mark as New
- Bookmark
- Subscribe
- Mute
- Subscribe to RSS Feed
- Permalink
- Notify Moderator
- Mark as New
- Bookmark
- Subscribe
- Mute
- Subscribe to RSS Feed
- Permalink
- Notify Moderator
Hi,
First these are functions of "k". They should be carried over into function for v2 "f_v2"
you need a small correction in the last term of function "f_v2(k)" to match what you provided.
The root of the equations (where they cross v1 axis with v2 = 0) is by inspection 0,0
With what you have provided v1 does not appear in the equation for v2??

