Community Tip - Learn all about the Community Ranking System, a fun gamification element of the PTC Community. X
- Subscribe to RSS Feed
- Mark Topic as New
- Mark Topic as Read
- Float this Topic for Current User
- Bookmark
- Subscribe
- Mute
- Printer Friendly Page
Scale in 2d plot
- Mark as New
- Bookmark
- Subscribe
- Mute
- Subscribe to RSS Feed
- Permalink
- Notify Moderator
Scale in 2d plot
Hello all,
I have two questions regarding the use of the 2d interpolation function:
- As you can see in the attached file, I cannot display the x-axis in the right way.
- How can I use the fit function for the get the results from an input array?
Thank.you very much!
Enrico
Solved! Go to Solution.
- Labels:
-
Statistics_Analysis
Accepted Solutions
- Mark as New
- Bookmark
- Subscribe
- Mute
- Subscribe to RSS Feed
- Permalink
- Notify Moderator
A standard 3D plot of a 2D array uses array indices for X and Y axis. To plot the FIT function, use "CreateMesh"

- Mark as New
- Bookmark
- Subscribe
- Mute
- Subscribe to RSS Feed
- Permalink
- Notify Moderator
Hi Enrico Belmonte,
You have simply to remake the 3d plot, as I have done:
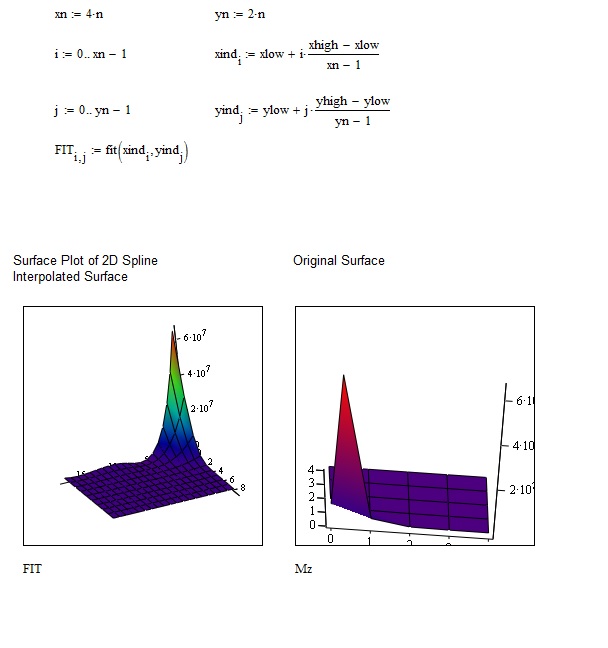
Saluti
FM
- Mark as New
- Bookmark
- Subscribe
- Mute
- Subscribe to RSS Feed
- Permalink
- Notify Moderator
Hello FM,
Thank-you for your reply.
However on the x-axis I get vales between 0 and 10 and not between 1E4 and 2E4.
What about the second question?
Thank-you very much!
Enrico
- Mark as New
- Bookmark
- Subscribe
- Mute
- Subscribe to RSS Feed
- Permalink
- Notify Moderator
It seems to me that it's okay!?!?
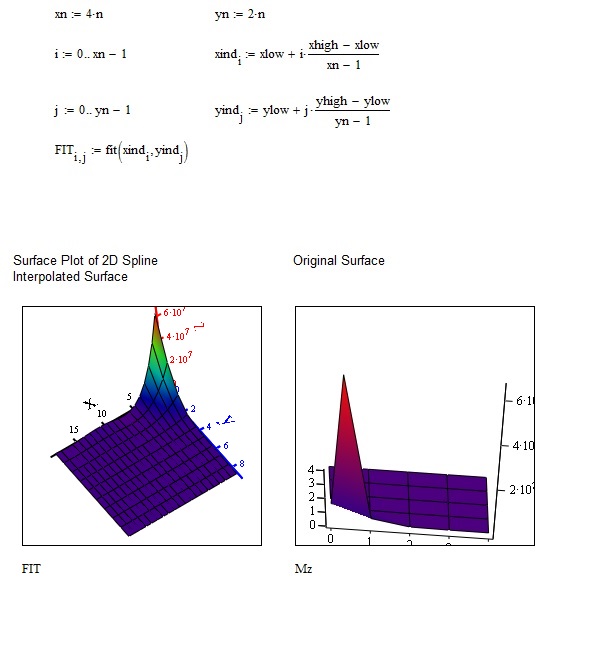
Furhermore, you can use the following program for a more accurate plot, but with the condition that the input matrix be a square one:
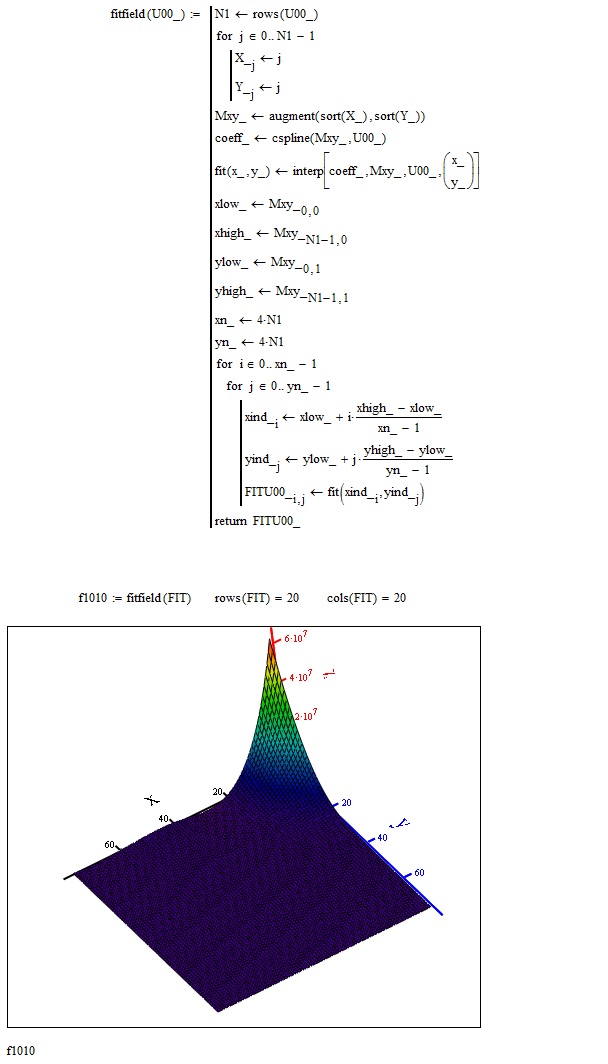
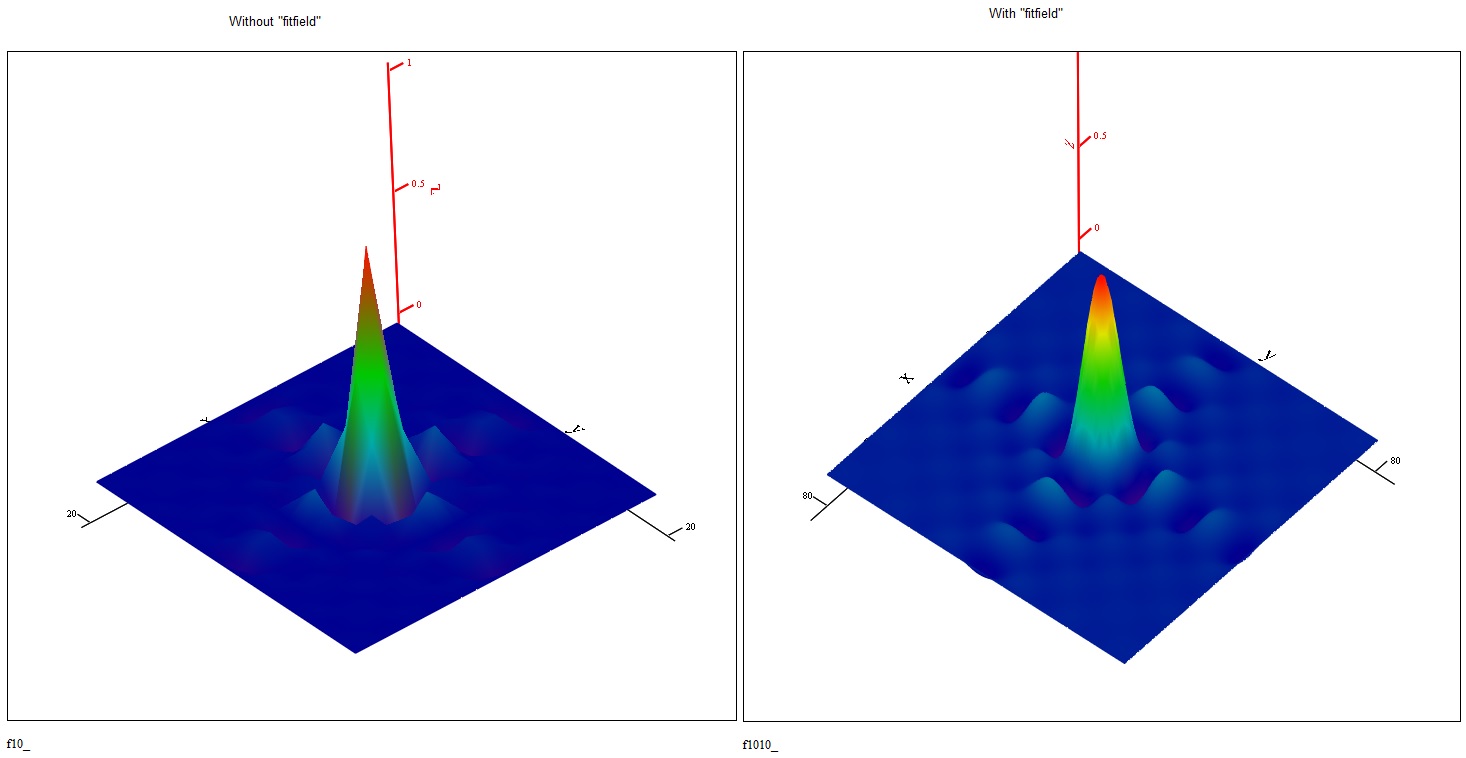
Example of "fitfield" use, plotting the function f(x,y)=sin(x)*sin(y)/(xy)
- Mark as New
- Bookmark
- Subscribe
- Mute
- Subscribe to RSS Feed
- Permalink
- Notify Moderator
> It seems to me that it's okay!?!?
No, the scale in x- and y-direction is not as requested.
- Mark as New
- Bookmark
- Subscribe
- Mute
- Subscribe to RSS Feed
- Permalink
- Notify Moderator
A standard 3D plot of a 2D array uses array indices for X and Y axis. To plot the FIT function, use "CreateMesh"

- Mark as New
- Bookmark
- Subscribe
- Mute
- Subscribe to RSS Feed
- Permalink
- Notify Moderator
- As you can see in the attached file, I cannot display the x-axis in the right way.
Guess its easier than you think:
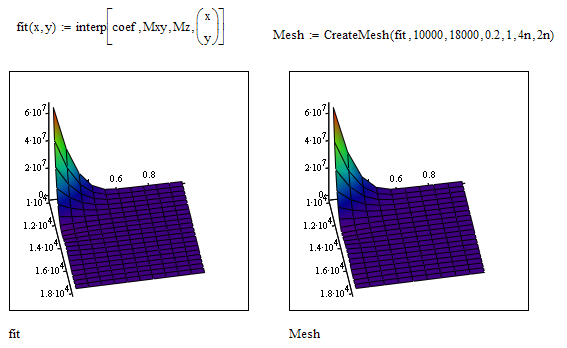
Using the first method (directly plotting the fit function) you would have to provide the ranges for x and y and also the number of grid in the "3D-Plot Format" window in the "Quickplot" tab.

So generally using Createmesh provides more flexibility and usually is the preferred method.
- How can I use the fit function for the get the results from an input array?
Input array? not sure what you want to achieve.
- Mark as New
- Bookmark
- Subscribe
- Mute
- Subscribe to RSS Feed
- Permalink
- Notify Moderator
Dear Mr. Exinger,
Thank-you for your reply.
I would like to calculate the fitting function using two input arrays instead of computing the values of the fitting function for a couple of values only.
Thank-you very much!
Enrico

- Mark as New
- Bookmark
- Subscribe
- Mute
- Subscribe to RSS Feed
- Permalink
- Notify Moderator
Guess you need to use vectorization:


